David R. Lovell, David Simon & Ah Chung Tsoi
Department of Electrical and Computer Engineering, University of Queensland, 4072 Australia
The neocognitron is an artificial neural network which applies certain aspects of the mammalian visual process to the task of 2-D pattern recognition. The resulting network model is complex in both structure and parameterization. We describe experiments which show that the performance of the neocognitron is sensitive to certain parameters whose values are seldom detailed in the relevant literature. We also present results which suggest that the selectivity parameters in the neocognitron can be adjusted in a straightforward manner so as to improve the classification performance of the neocognitron.
Fukushima's neocognitron [2,3,4] has received attention over the past decade as a partially shift invariant [1,8], distortion tolerant classifier. It is one of the most complex artificial neural network structures to simulate, and this is perhaps the main reason that its performance has not been scrutinized to the extent of other, comparatively simpler networks. There are a large number of adjustable parameters in the neocognitron and papers detailing its application to practical problems frequently omit information about the specific parameter values employed. This may lead the casual observer to assume that the neocognitron is robust enough to perform well with a range of parameter settings but this is not necessarily so.
This paper aims to inform the reader that the neocognitron requires careful tuning in order to obtain peak performance. After conducting numerous experiments with the neocognitron, it is our opinion that claims about the performance of the neocognitron in the absence of extensive testing should be treated with caution. We also present a data-driven method of adjusting the selectivity parameters for a specific instance of the neocognitron, and show how this method can be used to improve classification performance. Existing methods for adjusting these parameters have been shown to be unsatisfactory in a practical context [7].
The neocognitron classifies input through a succession of functionally equivalent stages. Each stage extracts appropriate features from the output of the preceding stage and then forms a compressed representation of those extracted features. The compressed representation preserves the spatial location of the extracted features and becomes the input to the next stage. Classification is achieved by steadily extracting and compressing feature representations until the input is reduced to a vector whose elements are similarity measures between the input pattern and the different input classes that the neocognitron has been trained to classify.
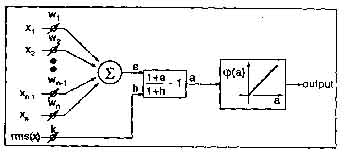
Figure 1: The structure of an S-cell.
In the neocognitron, feature extraction is performed by arrays of S-cells (called S-planes) that have been trained to respond to certain features that characterize the input patterns. Each S-cell receives input from a rectangular region of cells in the preceding stage. The input regions of the S-cells in the array uniformly cover the preceding cell planes. In any S-plane, the connection strengths between each cell and its input region are identical. This weight sharing ensures a translationally invariant response to features in the input cell plane.
The C-cell planes (C-planes) are a compressed approximation of the activity in the preceding S-planes. This provides a degree of translational in variance [1, 8] to the responses of the preceding S-cells. Ultimately, this compression of activity reaches the stage where the input pattern is represented by a set of single C-cells, each corresponding to an input class that the neocognitron has been trained to recognize. At this stage, the C-cell with the highest activity represents the class to which the input belongs.
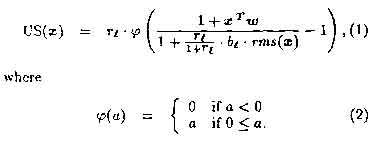
The feature extracting S-cells contain the only elements of the neocognitron that are modified during the training phase of the network. The neocognitron can be trained under supervision or allowed to self-organize. Our experiments utilize supervised learning since it is completely reproducible and deterministic. (The reader is referred to [3] for details of the unsupervised case.) The output of an S-cell (US(-)) in response to an input vector x is expressed as a function phi(-) of a cell's activation:
The weight vector (w) and inhibition coefficient (b) of the S-cell are determined by the learning rule. During supervised training, the S-cell is presented with a number of similar training vectors that it must learn to respond to. The learning rule ensures that the w points in the direction of the sum of these vectors and that b=w.
The root mean square activity of the input to the S-cell is defined by
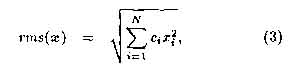
where the vector c = [C1, ..., CN] describes a Gaussian kernel that serves to accentuate inputs towards the centre of the cell's input region, as well as implementing the arithmetic mean of the inputs.
In Eq. (??) the selectivity parameter, rl, determines how closely the cell's input must correspond to the inputs it has been trained with in order to elicit a response. As the value of r/ becomes larger, the region of input pattern space containing input vectors that the S-cell will respond to (known as the acceptance region) decreases in volume.
The outputs of the cells in a C-plane give a compressed and blurred representation of the activation present in the preceding S-plane(s). Blurring of input activation is achieved by performing a weighted sum of inputs using fixed weight vector, d = [d1,.. . ,dn] , that describes a Gaussian kernel.As was the case with the c vector in the S-cell, the d weights accentuate those inputs near the centre of the C-cell's input region.
To obtain the compressed representation of S-plane activity, a C-plane contains a smaller number of cells than the S-plane preceding it and the C-cell input regions overlap so as to subsample that activity.
If we use x to denote the activations within a C-cell input region then the output of the C-cell (UC(-)) can be expressed as
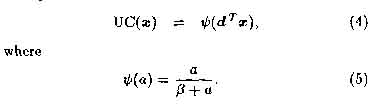
The value of B determines how rapidly the output of the C-cell becomes saturated. Our experiments have shown that B directly influences the recognition accuracy of the neocognitron but space does not permit us detail our findings on this issue.
The neocognitron is a complex network with an abundance of adjustable parameters. Most of the literature on the neocognitron sidesteps the issue of the effect that these parameters have on classification performance. Although it is well known that the values of TI have a direct bearing on the performance of the neocognitron, we have observed that the steepness of the Gaussian kernels and the value of /3 are also strongly linked to recognition accuracy.
The performance of a neocognitron that has undergone supervised learning is primarily dependent upon the feature set with which it was trained and the general structure of the network. The same feature set and network structure (as described in [3]) were used throughout this experiment so that a proper comparison of performance statistics could be obtained.
To assess the performance of a classifier to within 5% of its true value, with 95% confidence, it is necessary to perform at least 385 trials [6]. We used a test set of 400 digits3 to examine how a variety of parameters affected recognition rates.
Fukushima [4] and Menon et al. [8] describe two slightly different approaches to calculating the weights for the c and d Gaussian kernels. If we let v be a two-dimensional vector offset from the centre of the kernel then the weight at that position can be expressed as
where 0 < rl,bl < 1. Fukushima specifies that a = 1 whereas Menon and Heinemann opt for sigma = max,|v|,resulting in a less steep kernel than that obtained by Fukushima.
Table ?? shows that the shape of the Gaussian kernel has a significant effect on recognition accuracy of the neocognitron. The performance improvement obtained when the input region of a cell is unweighted (ie. the flat kernel) supports Hildebrandt's conjecture that the c and d masks are unnecessary [5, part III.B].
Table 1: Neocognitron performance with three different kernel shapes. The values of TV used were 1.7, 4.0, 1.5, 1.0 (ri through to r4). The values of 7^ and St for the Fukushima and Menon type kernels are as in [4] and for the flat kernel, it = t>t = 1.
| Kernel Type | % Correct | % Wrong | % Reject |
| Fukushima | 52.50% | 26.25% | 21.25% |
| Menon | 61.50% | 30.75% | 7.75% |
| Flat | 60.00% | 32.75% | 7.25% |
To date, there have only been two methods suggested for choosing appropriate ri values. The first was suggested by Fukushima and Miyake [2] but their approach is really only suitable for tuning rl(the first layer selectivity) in a simplified implementation of the neocognitron.
More recently, Hildebrandt [5] has proposed a closed-form training algorithm which ensures that at most one S-cell will respond to an input feature at a given location. This approach is based on the premise that if two or more S-cells (in different S-planes) respond to the same input then there is a degree of overlap in the acceptance regions of the cells and the discriminatory ability of the neocognitron is compromised.
Although Hildebrandt's closed-form training algorithm is theoretically appealing, it has some practical failings [7]. In short, there is a tendency for the closed-form algorithm to adjust the S-cell selectivities so that even the original training patterns of an S-cell are not recognized.
Choosing the rl for each S-cell in the neocognitron to maximize classification performance remains an open problem. However, the approach which we propose in the following section demonstrates a practical means of choosing r2 and r3) in a specific instance of the neocognitron, so as to improve the performance of the network. It is possible that extensions of this approach would be useful for handling more general cases.
The approach we propose for tuning r2 and r3 in the neocognitron is based upon one assumption and two facts.
Considering these three points, we ask "how do the r2 and ra parameters affect the classification performance of the neocognitron?"
We performed a series of simulations to "map" the performance of the neocognitron with respect to parameters r2 and r3. As a result of these tests (and their statistical accuracy) we hypothesize that, for the problem of digit recognition, the performance surface of the neocognitron is unimodal for variation of TI and r3. In the following discussion we shall refer to the performance surface shown in Figure ?? but we point out that we have obtained several such surfaces (for both classification and misclassification performance), all of which comply with our hypothesis of unimodality.
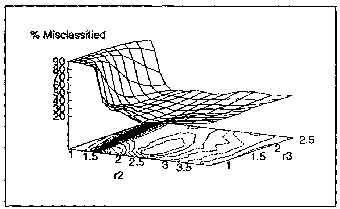
Figure 2: The misclassification performance surface obtained with a neocognitron using Menon's mask generation approach and 0 = 4. The jt and 8( values were as in [4]. The minimum misclassification rate of 15.75% occurred at (r2,r3) = (2.02,1.43). For this network, the maximum classification rate occurred at (r2,r3) = (1.27,1.60).
Figure ?? shows a plot of the misclassification rate of the neocognitron vs. r2, r3. Low values of r2 which cause saturation of activity on the network, tend to cause all inputs to be classed the same. Since the test set consists of equal numbers of digits from 0-9, the network incorrectly classifies 90% of the data in those cases.
Ideally, the goal of a performance improvement method would be to choose (r2, r3) so as to minimize the number of incorrectly classified input patterns whilst maximizing the number which are identified correctly (using as few tests as possible). Our experiments have shown that the (r2, r3) values which minimize the misclassification rate are usually close to, but different from those that maximize correct classification.
If we simplify our objective to that of minimizing misclassification with the minimum number of performance tests, a straightforward method for doing this is to model the performance surface of the neocognitron by some function whose minimum is easily determined. We may then fit that function to our observations of the network performance and estimate the performance minimum analytically.
In the case of the misclassification surface shown in Figure ??, if the misclassification rates above 80% are ignored then the performance surface can be approximated well by a quadratic equation of the form
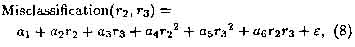
where e represents the error of fit and ai~ae are the coefficients which can be adjusted to minimize the mean square of t over the surface. Since this function has six parameters, a minimum of six observations of network performance are required to specify the surface and hence estimate the location of the minima.
For the surface in Figure ??, the minimum of the best fit quadratic surface occurs at (r2,r3) = (2.4,1.9) and the actual misclassification rate at that point is approximately 21%. Considering that each data point on that surface is within 5% of the true misclassification rate of the network (with 95% confidence), our estimate of the (r2,r3) which will give minimum misclassification is reasonably close to the parameters which were measured as giving the minimum misclassification rate ((r2,r3) = (2.02,1.43)).
Table 2: Estimates of the (r2, r3) which give minimum misclassification. These estimates ignore observations of misclassification rates that are above the percentage in the leftmost column. The actual misclassification rates at each (r2, r3) estimate are shown in the rightmost column.
| Ignore | R2 | R3 | % Misclassified |
| >80% | 2.4 | 1.9 | 21.0% |
| > 70% /td> | 2.4 | 1.8 | 22.0% |
| >60% | 2.3 | 1.9 | 20.0% |
| > 50% | 2.2 | 1.8 | 19.5% |
| > 40% | 2.2 | 1.8 | 19.5% |
| >30% | 2.0 | 1.8 | 17.0% |
| >25% | 2.0 | 1.7 | 16.7% |
We have observed that the accuracy of fit and estimates of minimum locations improve when we consider only data points within a certain distance of the estimated minimum. Since the performance surface is unimodal, this can be achieved by ignoring data points with misclassification rates above a certain cutoff when fitting the quadratic equation to the surface. Table ?? shows that as we restrict the samples of the misclassification surface to those below a given threshold, so our estimate of the best (r2,r3) improves. This suggests that a reasonable method for finding the selec-tivities that minimize the misclassification rate would be to roughly estimate the location of the minimum by observing the performance of the network with six different (r2,rs) parameter pairs. Then choosing another six different parameter pairs close to the estimated minimum, a more refined estimate of the minimum could be obtained,
We have examined the neocognitron's classification performance subject to variation of a number of parameters. The number of test samples used in our experiments means that the performance estimates we have obtained are within 5% of the true performance statistics with 95% confidence. Our results indicate that small alterations to the form of the Gaussian masks employed in the neocognitron can cause significant variation in the classification performance of the network. The accuracy of our performance estimates and the estimates obtained for the neocognitron over a range of layer 2 and 3 selectivities indicate that the performance surface of the neocognitron is unimodal with respect to r2 and r3.
Under this assumption, we have described a method of tuning r2 and r3 to obtain improved classification performance with only a small number of performance tests.