 Today, when Ukraine is moving to the side of the west economy, that means passing of the rules of their economic game, stock trading is gaining particular actuality. 95% commodity circulation of well-developed countries takes place in a stock exchange. Also for Ukrainian entrance to the WTO very essential to get knowledge of basis of the stock trading. Actuality against a background of the science caused by wide application of statistic, mathematical and economic methods for achievement successful trading on the stock exchange.
The purpose of this work is an optimization of the computer trading system (stock), by profitability, with using analysis of indicators for realization of the computer trading system. During the process of investigation we should lay down next aims:
- selection the indicator for realization of the computer trading system
- optimization the system by profitability.
Scientific novelty of the work is in optimization of the indicator selection, that gives best results. Every indicator has an algorithm of definition of the buy/sell signals.
For example, lets examine algorithms of the next indicators:
1. 1. Moving average
One of the simplest methods of exposure of the trend on the price graphs is the use of moving average. The moving average are two types: simple moving average (MA) and weighed moving average (WMA). The exponential moving average (EMA) are the frequent case of weighed moving average. In the technical analysis there is moving average, calculated on an averaging-out interval, belong on the end of this interval (adaptive moving average).
1.Simple moving average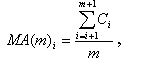
where: m-relative time of averaging-out; - close price of the i bar.
2.Weighed moving average:
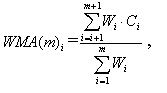
where:  - gravimetric coefficient at adding up
The weighed moving average differ by the laws of forming of gravimetric coefficients. In the simplest case, for example, for m=5 next values are used:  : 5/15; 4/15; 3/15; 2/15 č 1/15.
3. Exponential moving average:
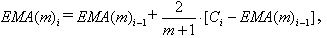
where:  - gravimetric smoothing out coefficient relying on the equivalent size of m.
We pass to the algorithms of generation of trading signals.
The simplest trading system generates the trading signals of entrances on the following algorithm: 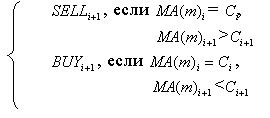
More reliable trading signals of buy and sell can be got, using crossing of "slow" and "rapid" moving average. In addition it is necessary to take into account position of the price graph:

For upgrading trading signals of algorithms an additional condition is often entered in them: the moving average after crossing must be multiplied (to diminish) on the definite number of points, for example, on 10. The values are usually set  for "rapid" and
  for "slow moving average ". In algorithms it is possible to use any types of moving average. Thus their kind not to change.
2. MOMENTUM and it's trading signals
Most widespread in the technical analysis is the MOMENTUM indicator: 
where:  - the current value Momentum;
 - accordingly close price of the i and (i-p)th bar.
The given expression is close determination of derivative the price graph by numeral methods. Thus Momentum economic it is possible to interpret how speed of price change of closing or speed of growth (decreases) of trend.
Trading signals, generated with the use of Momentum, it is possible to get: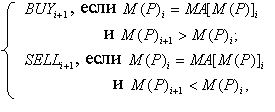
where:  - value of Momentum i bar;
  - moving average
The given algorithm is used in the case of the small orders P. Thus strong to irregularity crooked Momentum results in the great number of false trading signals. The traditional algorithm of generation of trading signals with the use of Momentum has a kind: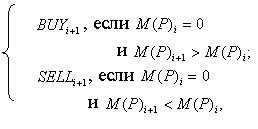
The value of the P size for both algorithms usually lies in limits  (it is found for a concrete market in a concrete history period by testing and optimization of algorithms).
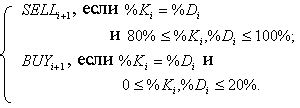
3. Trading signals of STOCHASTIC
Actually under the common name Stochastic hide two different oscillators: %K (rapid) and %D (slow). The most meaningful trading signals allow these oscillators to generate in the areas of overbought and oversold. When other oscillators in these areas generate mass of false trading signals, at Stochastic this failing it is considerably less. Any modern trading system does not do without Stochastic.
The considered oscillator consists of two crooked (two oscillators):
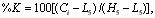
where:  - current close price;
  - the most less value Low from the last five bars;
 - the more greatest value High from the last five bars.
Curve %K it is a "rapid oscillator". The second oscillator %D it is simple moving average the first oscillator at m=3:
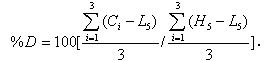
Curve %D it is a "slow oscillator". Oscillators %K %D change in time in limits from 0 to 1 (0.100%). In order to generate trading signals by Stochastic, it is necessary to select two areas of his stay: 100%.80% and 20%.0%. The first region is named the area of overbought, and second - area of oversold. The algorithm of forming of trading signals by Stochastic is following:
4. Buy/sell signals from MACD
As well as crossing of two sliding middle, the given instrument is intended for the analysis of trend's markets. In the case of his use in languid or parallel trends, he generates the great number of false trading signals.
The MACD indicator consists of two crooked:
- rapid crooked MACD;
- slow crooked MACD.
The algorithm of the MACD calculation is following thus: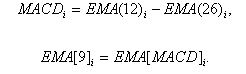
The first algorithm allows to calculate rapid MACD, and second - slow.
The algorithm of generation of handling auction signals by MACD is following:
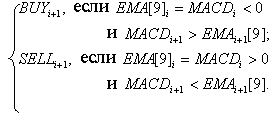
The signals of meeting (identical orientation of trend of the price graph and MACD) and divergence are the most effective trading signals from MACD (a different orientation of MACD trend and price graph). The signals of meeting predict invariability of trend price in the nearest period, and divergences - credible change of tendency.
The algorithm resulted higher provides less effective trading signals, than signals of meeting/divergence. However the signals of meeting/divergence are enough rare. The signals of meeting/divergence are often used as filtering (for the rise of authenticity of algorithm).
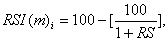
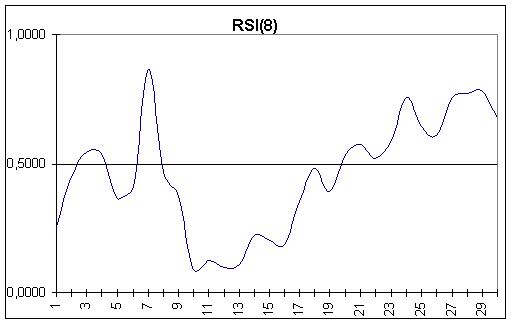
5. Trading signals of RSI oscillator
Oscillator RSI is used for the analysis of all markets. He is most effective, as well as all other oscillators, on languid, not trends markets or at presence of Flat. The index of relative strength (RSI) compares efficiency of security in the present with its own efficiency in the past.
The algorithm of the RSI calculation is following:
The algorithm of forming of trading signals on the basis of RSI has a kind:
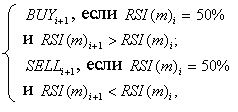
Most often in the technical analysis RSI(8) and RSI(14)are used. As well as in the case of MACD, signals from meeting/divergence of trends of the price graphs and trends on RSI are the most effective signals RSI.
Practical value of this work consists of minimization of the trader mistakes during the trading on the stock exchange. It is realized by helping of application of the optimized trading signals, generated with help of indicators.
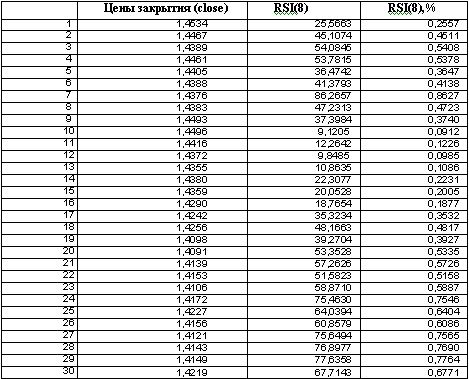
Here is an example of the definition of the optimal value of RSI indicator, accordingly in 8- and 4-days periods with dataprice of 01.2002.
Table 1.4-days indicator RSI(4)
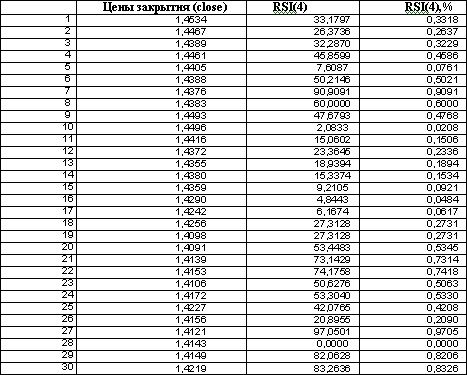
Table 2.8-days indicator RSI(8)
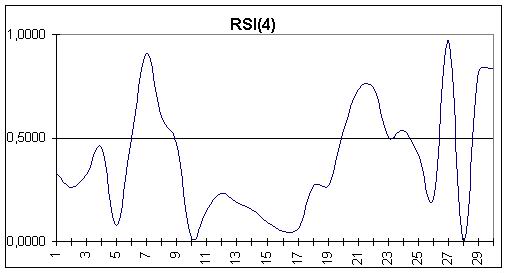
The values of the RSI indicator inflict within the limits of vertical co-ordinates from 0 to 100. When an index is higher or below 50, an index registers the state of overbought or oversold accordingly. When the indexes of index are found higher or below 50, a role model which name the "failed scope" can appear on the graph of oscillator. She consists that at an ascending tendency a next peak of curve of index (higher 50) does not so achieve the level of previous peak, whereupon there is falling of curve below than level of previous slump. The "failed scope" in position of foundation takes place, when a falling index (below 50) however does not go down below than level of previous slump, and then, rising, excels a previous peak. Divergence between the curve of the RSI index and curve of motion of prices at the values of index is higher or below 50 - serious signal to ignore which it is dangerous. The most value RSI consists in possibility of analysis of the "failed scopes" or divergences what am going on, when an index takes on critical values. Any strong tendency - regardless of whether she is directed upwards or downward, usually enough quickly compels oscillators to take on critical values. In such cases, as a rule, it is premature to suppose that a market is bought back or resold, such error can force early closure of profitable positions. For example, at the strong tendency of growth a market can remain bought back during the enough protracted time. One only that the values of oscillator are found in an overhead critical region, does not mean yet, that it is needed to liquidate long positions. The first appearance of value of oscillator in area of overbought or oversold - usually just warning. By more persistent signal claiming most intent attention, there is the second appearance of curve in a critical region. In case if it does not confirm further growth or price (the curve of oscillator here forms a double top or foundation)decline, it is had to speak about possible divergence and take proper measures with the purpose of defence of existent positions. If a curve turns in other side and blocks the level of previous peak or slump, it means that the signal of divergence or "failed scope" is confirmed. The algorithm of forming of trading signals by RSI is resulted higher
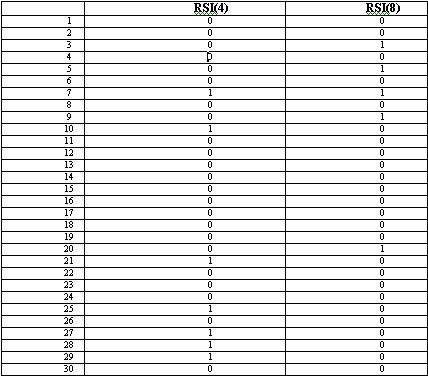
Next, with help of above algorithm, we should define buy/sell trading signals. In table 3 (0-absence of buy/sell signal, 1-accordingly, buy/sell signal).
Table 3. Trading signals RSI(4) and RSI(8)
Optimization of the computer trading system
The calculation of coefficient of correlation between basic data of costs of closing and data got by the RSI indicator accordingly after 4 and 8 days is the final stage of computations.
For the receipt of coefficient of correlation it is necessary to build the exchange diagram of costs of closing and define trading signals.

Table 4.Trading sagnals of close prices RSI(4) and RSI(8)
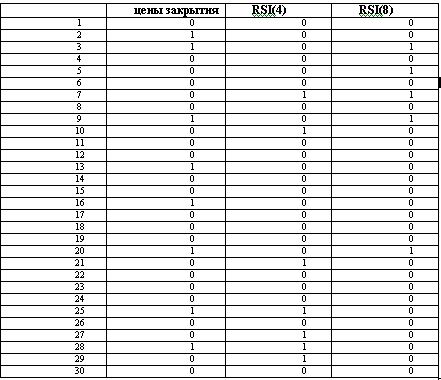
We will calculate the coefficient of correlation between the trading signals of close price, RSI(4) and RSI(8).


As a result of research, it is visible, that it is optimum to use the indicator of the relative force RSI for a 8-days period, because he most exactly shows trading signals to the purchase or sale of currency. The method expounded in the given work is intended, above all things, for the analysis of financial markets. However, she has universal application in those regions, where a plenty of the data presented graphically is. Any scientific discipline using quantitative methods and notion of "tendency of development" is the potential field for application of methods of technical analysis. Also causes a concern the circumstance that to financial safety of investors is not spared so intent attention, and not existed hard requirements to testing and analysis of the methods used for trade by their facilities. That causes a concern also, that as though reasonable and formed people make decisions, based on the cleanly "artistic, subjective methods" of analysis, the same risking by tremendous amounts. Certainly, application of those or other strategies proves to be correct to those, that once in the past they worked effectively. Unfortunately, it was in the past. In addition, successes, failures, are memorized only, as a rule, are ignored. Analysing conducted job performances it is possible to do a conclusion about that the market analysis is impossible without the use of indicators. The offered method of computation of the RSI indicator, in particular finding of trading signals and computation of coefficient of correlation, is applicable at the use of other indicators.