Sourse: http://www.rgrossman.com/dl/proc-091.pdf
Real Time Change Detection and Alerts from Highway Traffic Data
Robert Grossman (Team Lead) and Michal Sabala (Technical Lead)
Anushka Aanand, Steve Eick, Leland Wilkinson, and Pei Zhang
National Center for Data Mining
University of Illinois at Chicago
John Chaves and Steve Vejcik
Open Data Research
John Dillenburg, Peter Nelson and Doug Rorem
Department of Computer Science
University of Illinois at Chicago
Javid Alimohideen and Jason Leigh
Electronic Visualization Laboratory
University of Illinois at Chicago
Mike Papka and Rick Stevens
Argonne National Laboratory
Abstract
We developed a testbed containing: real time data from over 830
highway traffic sensors in the Chicago region, data about weather,
and text data about events that might affect traffic. The goal was to
detect in real time interesting changes in traffic conditions. Given
the size and complexity of the data, we choose to build a large number
of separate baseline models. We built a separate baseline for
each hour in the day, for each day in the week, and for every 2 or
3 traffic sensors, resulting in over 42,000 separate baseline models.
We also built a baseline engine to build the necessary baselines automatically.
We modified an open source scoring engine to process
in real time each new sensor reading, update the appropriate feature
vectors, score the updated feature vectors using the baseline models,
and send out real time alerts when deviations from the baselines
were detected.
1 Introduction and Purpose
It is an open and fundamental research problem to detect in real time significant and interesting changes in complex, multi-modal
data sets of sensor data. The problem is difficult because of the
following challenges:
- Identifying changes in large, complex, multi-modal data sets
is difficult.
- Detecting changes in real time increases the difficulty of the
problem.
- Keeping algorithms up to date, with rapidly changing data is
a challenge.
- Extracting features across different data modalities and combining
them in a meaningful way is a challenge.
In this application, we integrated real time highway traffic data from
the Chicago region with several other data sets and identified interesting
changes in the data. Broadly speaking, our approach is based
upon the following ideas:
- To deal with the first challenge, we build a very large number
of very fine grained baselines. For example, we build a
separate baseline for each hour in the day, each day of the
week, and each region of the highway. This results in over
42,000 separate baselines, each of which is a separate analytical
model. Note that the number of models we use in this
application is larger than the number of records in many data
sets. For this challenge, we developed an application to build
these baselines automatically that can be run as often as required,
for example, every few days.
- To deal with the second challenge, for each new data event,
we process and score this event in real time using a high
performance scoring engine [3]. This requires that for each
event, we a) access and update all relevant feature vectors; b)
score each feature vector using the appropriate change detection
models; and c) for scores that exceed thresholds, send
alerts out. For this challenge, we adapted an open source,
high performance scoring engine to work with ensembles of
change detection models. Specifically, we used ensembles of
CUSUM models [1]. When deviations from baselines were
detected, we signaled a handheld computer (PDA) in order
for the right person to be informed of the change.
- To deal with the third challenge, we developed a standard
XML representation of a change detection model, as well as a
mechanism for describing collections of baselines. Using this
we built an application that could analyze daily data and, if required,
rebuild baselines and deliver them as XML files to the
scoring engine. In this way, we automated, in part, rebuilding
baselines so that the appropriate baselines were always up to
date.
- To deal with the fourth challenge, we developed an integration
platform so that the various different data sets were brought to
a common format for subsequent analysis.
This note is a preliminary description of our work and contains an
overview of our approach. A more complete description of this
work is currently under preparation.
2 Pantheon Gateway Testbed
Today, research in data integration, real time data mining, an change detection is hindered by the lack of availability to researchers
of large collections of heterogeneous data that can be used
for developing and testing new technologies. In the Pantheon Gateway
Project, we are archiving highway sensor data, meteorological
data, text data about special events that may affect traffic, and text
data about traffic accidents. This data is archived each day and
made available to the research community for testing novel data
mining, data integration and data assimilation strategies.
Prior to this project, highway sensor data was collected, but
not archived, by the Gateway System that coves the three state,
fifteen county Gary-Chicago-Milwaukee (GCM) corridor. The
Gateway System uses 830 fixed traffic sensors, in addition to
other data sources, to compute real-time traffic congestion conditions
and to display this data to the public at two websites
http://www.gcmtravel.com and http://www.travelinfo.org.
The Pantheon Gateway Testbed archives this data, overlays additional
data, and makes this available to the research community
as a resource. About 173,000 sensor readings are added
each day. The data set currently (July, 2005) contains over
53,000,000 sensor readings. For more information, please see
www.teraflowtestbed.net.
3 Pantheon Gateway Data Set
The data for this application consists of the following:
- Real time sensor readings from over 830 sensors in the
Chicago region providing the speed, volume and occupancy
of the traffic approximately every six minutes. Although the
sensors report data more often, we are only allowed to query
the Illinois Department of Transportation database every six
minutes. As mentioned above, we add about 173,000 sensor
readings to our database every day, and today (July, 2005),
there are over 53,000,000 sensor readings in our testbed.
- XML data, updated several times a day, that describes the current
weather in the Chicago region.
- Text messages, provided as RSS feeds, describing special
events in Chicago that may effect traffic.
For the application described in this paper, we analyzed approximately
750 GB of data collected over 11 months.
Note that this data includes structured relational data (sensor readings),
semi-structured XML data (weather data), and unstructured
text data (the data describing the special events).
Part of the challenge of this application is to combine all of this
data in a meaningful way so that baselines can be computed, statistically
significant deviations from these baselines be detected, and
quickest identification of accidents and other unusual events can be
forwarded as alerts.
4 Approach
This application uses a variety of analytic methods.
- Ensembles of Baselines. For this project, we have developed
a new method to create and update baselines for complex
multi-modal data sets using an ensemble (or collection)
of baseline models. In particular, this application uses over
42,000 separate baseline models—one for each hour, one for
each day, and one for approximately every 3 sensors.
- Real Time Change Detection. To detect changes relative to
the baselines we use an event based approach, in which each
sensor reading is considered to be a new event. The event i)
updates persistent state information associated with the relevant
model; ii) computes a score; iii) compares a score to the
baseline score; and iv) triggers an alert if there is a significant
difference between the computed score and the baseline score.
An open source event based scoring engines is used to compute
these changes. This scoring engine’s support for change
detection was developed in part for this project.
- Tree-based Classifiers. We use tree base classifiers to decide
whether a change in traffic conditions is likely to be the result
of an accident, versus other probable causes such as weather,
special events, or construction.
- Visual Analytics. We created an integrated visualization of
all the available data suitable for a 2x2 tiled display. In particular,
the different data sets and modalities were layered on
top of each other, with buttons used to overlay different data
sets and rapidly toggle between them. This turned out to be an
effective means of understanding the significance of changes
in certain regions.
The methods and approach described have proved to be flexible and
robust. The same approach and methods have been recently applied
to identify data quality problems for a large commercial payment
system.
5 Architecture
The application consists of the following components:
- Data Integration Engine. We built a data integration application
that integrates multiple streams of sensor and related
data in a format appropriate for analysis.
- Baseline Engine. We developed an application that builds
segmented collections of baseline models, given a XML description
of how the data should be segmented in each dimension.
For example, separate baseline models may be built for
each hour in the day, each day in the week, and every two to
three sensors.
- Visualization. We developed a visual analytics application
that presents a real time integrated view of the streaming data
and related predictive analytics. This is done using a 2x2 tiled
display that is designed for a single or small group of analysts
to use.
- • Scoring Engine. We adopted an open source scoring engine
to score ensembles of CUSUM models.
- • Classification Engine. We built an analytics application that
used tree based classifiers [2] to detect whether changes in
traffic patterns were likely due to accidents.
- Real Time Alerts. We built an application that sends alerts
out to PDAs in real time when scores produced by the models
exceed certain thresholds.
6 Implementation
For this project, we used several open source tools and packages
including Python, R, and PostgreSQL, as well as custom code.
- The data preparation, processing and persistence were done
using the open source tools listed above.
- The tree based classifiers were built using R.
- We also used an open source baseline and change detection
engine that we are developing in part for this project.
- Finally, we developed a visualization application that created
interactive images using SVG, Javascript, and Java Applets
that could be browsed with SVG enabled browsers.
7 Visualization of Results
We developed a browser based visualization of the real time
changes in traffic patterns detected using our scoring engine. This
browser based visualization uses an SVG based web page and
Javascript to display in an interactive fashion the following information:
- A map of the Chicago region.
- High revolution satellite images of the Chicago region.
- Real time traffic conditions, including speed, volume and occupancy.
- Real time detections of changes in traffic patterns (indicated
by small black circles)
- Real time detection of probable accidents (indicated by small
flashing rectangles)
- Text based messages about special events in the Chicago region
that may effect traffic, displayed in a text box reserved
for these types of events.
- Text based summary of current weather conditions.
The application can be accessed at highway.ncdm.uic.edu. Currently
only Microsoft Internet Explorer running on Windows machines
with the Adobe SVG plugin is supported.
8 Summary and Conclusion
Overall, the approach appears to provide a good means of identifying
changes in large, complex, multi-modal data sets. The architecture
we developed was able to build baselines on over 750 GB
of data, to process each new sensor event at line speed, and to send
out real time alerts to PDAs. In future work, we plan on developing
more accurate algorithms for building baselines, especially
baselines on very dynamic data.
9 References
- M. Basseville and I. V. Nikiforov. Detection of Abrupt
Changes: Theory and Application. Prentice Hall, 1993.
- Leo Breiman, Jerome H. Friedman, Richard A. Olshen and
Charles J. Stone, Classification and Regression Trees, Chapman
and Hall, New York, 1984.
-
Robert L. Grossman, Alert Management Systems: A Quick Introduction, in Managing Cyber Threats: Issues, Approaches
and Challenges, edited by Vipin Kumar, Jaideep Srivastava,
Aleksandar Lazarevic, Kluwer Academic Publisher, 2005, to
appear.

Figure 1. This figure shows how congestion is indicated in our
application. Red indicates congested highway segments, while
green indicates uncongested segments.
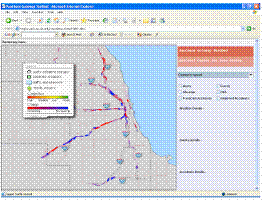
Figure 2. This figure shows how changes in speed are indicated
in our application. Red indicates that average speed is decaying
over time while blue indicates that the average speed is improving.
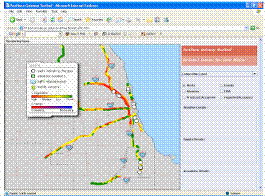
Figure 3. This figure shows how alerts were displayed in our
application. The alerts are indicated by small black circles,
with white centers. Each alert indicates a potentially interesting
change from normal behavior. Alerts are computed using
ensembles of CUSUM models. Over 42,000 different CUSUM
models were used in order to improve the ability of our application
to detect meaningful changes.

Figure 4. This figure shows how probable accidents were displayed
in our application. Each (flashing) square indicates a
probable accident. There is one such square near the center of
the screen. Probable accidents are computed using a classification
tree.

Figure 5. This figure shows how real time alerts were delivered
to a PDA.