URL:www.ims.tuwien.ac.at/~hme/papers/itcom2004-mining.pdf
Visual data mining is a novel approach to deal with the growing flood of information. The aim is to combine traditional data mining algorithms with information visualization techniques to utilize the advantages of both approaches. In this paper we provide a short overview on visual data mining with a focus on information visualization aspects. The amounts of data collected in corporate and public databases are increasing day by day. Databases with several terabyte of data are not uncommon any more. For example, the K-mart customer database is expected to grow up to 4-5 terabyte by the end of this year, andEnvisat, a satellite launched by ESA (European Space Association) to observe Earth’s environment at the beginning of this year, exceeded the terabyte mark for data transferred over a satellite channel in only 3 months [Wrol 02].
Data is not information. All the bits and bytes collected in these databases are without value if we cannot explore and analyse this data to extract meaning and to get insight. Standard data management systems do not provide the needed functionality. This problem is targeted in the field of Data Mining. Data mining denotes the analysis of huge amounts of data targeting to extract useful information, utilizing statistical mehods such as clustering techniques, Factor Analysis, Multidimensional Scaling, and AI-methods like Kohonen Networks. Data mining techniques are today an integral part of today’s data warehouse solutions. Nevertheless, current data mining tools are far from being optimal. In general, the complex parameters of available analysis techniques make it difficult to comprehend and control the mining process; consequently, data mining tools are sometimes awkward to use and the results are difficult to value.
From the very beginning, information visualization techniques have been considered to be a promising alternative to analysis methods based e.g. on statistic and AI techniques. Information visualization exploits the phenomenal abilities of human perception to identify structures by presenting abstract data visually, allowing the user to explore the complex information space to get insight, to draw conclusions and directly interact with the data. Visual data mining is a novel approach to data mining. It denotes the combination of traditional data mining techniques and information visualization methods. The utilization of both automatic analysis methods and human perception/understanding promises better and more effective data exploration. Visual data mining techniques have proven to be of high value especially in exploratory data analysis. They have high potential especially
•For exploring large databases,
•When little is known about the data and the exploration goals are vague, and
•When highly inhomogeneous and noisy data is given. Based on the degree of integration of information visualization and automated data mining techniques we can distinguish three classes of visual data mining solutions:
•No or very limited integration. This corresponds to the application of either traditional information visualization or automated data mining techniques on the raw data.
•Loose integration of information visualization and traditional data mining. Visualization and automated mining techniques are applied sequentially. The results of each mining operation can be used as an input to the following analysis step.
•Full integration of information visualization and automated techniques. This allows for the application of techniques from both fields in parallel; results can be combined, providing an integrated view on the data mining process and its outcome.
1. Visualization in Visual Data Mining Visualization is a key process in Visual Data Mining, and we will focus on this aspect in our paper. Visualization techniques can provide a clearer and more detailed view on different aspects of the data as well as on results of automated mining algorithms. Some of these aspects will be discussed in the following. We will focus on the information content and the information structure, in which the information is organized [Bert 77].
1.1. Visualization of the Information Structure The exploration of relationships between several information objects, which represent a selection of the information content, is an important task in visual data mining. Such relations can either be given explicitly – when being specified in the data - or they can be given implicitly, when the relationships are the result of an automated mining process, e.g. based on the similarity of information objects by hierarchical clustering.
A number of customized methods for visualizing an information structure have been developed. Most of them are based on the visualization of hierarchies. Here, we distinguish between space-filling and explicit techniques. Techniques of the first class show relationships between information objects by special arrangements. Popular examples for this approach are Treemap [Shne 92] and Sunburst [StZh 00].
Techniques of the second class represent relationships by edges.A well-known example for the latter approach is the Hyperbolic Viewer [Lamp95]. Its main idea is to use the hyperbolic plane for arranging the nodes of the hierarchy by radial layout and to achieve a focus area in the near of the midpoint by reprojection into the Euclidian space.
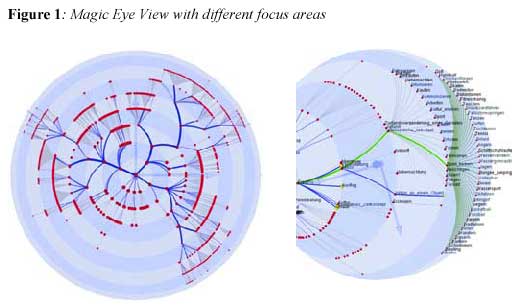
The Magic Eye View [KrLS 00] is another example for a explicit layout. Here, the layout is based on a 2D radial layout which is mapped onto a hemisphere. An additional projection is introduced in order to achieve a focus & context display and to enable a smooth transition between these regions. Figure 1 demonstrates this technique.
1.2. Visualization of Information Content In addition to exploring the information structure, the identification of structures in the data values is an important task in visual data mining. For this, techniques to visualize the qualitative and quantitative properties of information objects are required. In addition, these techniques usually have to deal with large amounts of multivariate data. Standard techniques in this context are panel matrices, parallel coordinates, icon and pixel based techniques.
Panel matrices arrange bivariate displays of adjacent attributes in matrix form. A popular visualization technique in this category is the Scatterplot Matrix, where multiple adjacent scatterplots are displayed in one image [Clev 93].
Parallel Coordinates map the n-dimensional space onto a two-dimensional plane. For each attribute a separate coordinate axis is constructed.These axis are positioned aside each other. Each information object is presented as a polygonal line intersecting each of the axes at the point corresponding to the value of the considered attribute.
In icon-based techniques the attribute values of an information object are mapped to the features of an icon. Icons may be defined arbitrarily - for example as little faces in the example of Chernoff Faces [Cher 73] or a colored symbol in the case of Needle Icons [AlKo 01], and Color Icons [Levk 91]. Figure 2 displays an example using morphed faces for the visualization of multivariate data. Pixel-based techniques push the idea of minimizing the size of an attribute in screen space even further to present even larger amounts of data [Keim 00].

1.3. Visualization of Information Objects Another set of visualization techniques focuses on the presentation of all aspects of information objects, mostly to support their identification, their analysis, or to find relations to other elements. Typical examples are the visualization of DNA sequences, documents, or search results. The transition to information graphics - specifically designed for a given application - is sometimes fluid.
2. Interaction Techniques Interaction is crucial for effective visual data mining. The data analyst to directly must be able to interact with the presented data and to change the visualizations and the mining parameters according to his needs. Also, interaction techniques may applied to enable the user to relate and to combine multiple independent views of the data.
Interaction techniques can be categorized based on the effects they have on the display. Navigation techniques focus on modifying the projection of the data on the screen, using either manual or automated methods. View enhancement methods allow users to adjust the level of detail on the visualization or of parts of it; furthermore, they allow for the modification of the mapping to emphasize some subset of the data. Selection techniques provide users with the ability to isolate a subset of the displayed data for operations such as highlighting, filtering, and quantitative analysis. Selection can be done directly on the visualization (direct manipulation) or via dialog boxes and other query mechanisms (indirect manipulation).
3. Conclusions Visual Data Mining is a novel, and efficient approach for exploring large data sets. The combination of automated mining methods and visualization techniques take advantage of both, computational power and the abilities of human perception. Since we could cover only few aspects of these technology see e.g. [KeMS 02] for further information.
4. References:
[AlMь 98] Alexa, Marc, und Mьller, Wolfgang: Visualization by Metamorphosis, In: Craig M. Wittenbrink and
Amitabh Varshney (Eds.): IEEE Visualization 1998 Late Breaking Hot Topics Proceedings, S. 33-36,
October 1998.
[AlKo 01] Abello J.; and Korn, J.: MGV: A system for visualizing massive multi-digraphs, Transactions on
Visualization and Computer Graphics, 2001.
[Bert 77] Bertin, J.: Graphics and Graphic Information Processing, deGruyter Press, Berlin 1977.
[Cher 73] Chernoff, H.: The use of faces to represent points in k-dimensional space graphically, Journal Amer.
Statistical Association, 68:361–368, 1973.
[Clev 93] Cleveland, W. S.: Visualizing Data, Hobart Press, New Jersey, 1993.
[Keim 00] Keim, D.A.: Designing pixel-oriented visualization techniques: Theory and applications. Transactions
on Visualization and Computer Graphics, 6(1):59–78, Jan–Mar 2000.
[KeMS 02] Keim, Daniel A.; Mьller, Wolfgang; und Schumann, Heidrun: State-of-the-Art Report Visual Data
Mining, State of the Art Report, Eurographics Conference 2002, Saarbrьcken, September 2002.
[KrLS 00] Kreuseler, M.; Lopez, N.; Schumann, H.: A Scalable Framework for information Visualization,
Proceedings InfoVis’2000, Salt Lake City, 2000, pp.27-36.
[Lamp 95] Lamping, J. et al: A focus+context technique based on hyperbolic geometry for viewing large
hierarchies. ACM Proceedings CHI’95, Denver, 1995, S. 401-408.
[Levk 91] Levkovitz, H.: Color Icons: Merging Color and Texture Perception for Integrated Visualization of
Multiple Parameters. Proceedings Visualization’91, IEEE Computer Society Press, Los Alamitos,
1991, pp. 164-170.
[Shne 92] Shneiderman, B.: Tree Visualization with Treemaps: A 2D Space Filling Approach. ACM
Transactions on Graphics, Vol.11, No. 1, 1992, pp. 92-99.
[ScMь 99] Schumann, Heidrun; und Mьller, Wolfgang: Visualisierung – Grundlagen und allgemeine Methoden,
Springer Verlag, ISBN 3-540-64944-1, Heidelberg, 1999.
[StZh 00] Stasko, J.; Zhang, E.: Focus+Context Display and Navigation Techniques for Enhancing Radial,
Space-Filling Hierarchy Visualizations, Proc. IEEE Information Visualization 2000, Salt Lake City,
UT, Oct. 2000, pp. 57-65.
[Wrol 02] Wrolstadt, Jay: Satellite Smashes Terabyte Data Barrier, NewsFactor Sci::Tech,
http://sci.newsfactor.com/perl/story/18424.html, June 2002.