Understanding noise
figures in radio receivers
Kevin
Faison, Integrated Circuit Designs, Inc.
B@02 22, 2006 (11:40
AM)
URL: http://www.commsdesign.com/showArticle.jhtml?articleID=188101578
Noise in radio receivers is of great interest to anyone involved in wireless
product design. Commonly used figures-of-merit include noise figure (NF),
sensitivity, minimum discernable signal (MDS), carrier-to-noise ratio (CNR),
error vector magnitude (EVM), signal-to-noise ratio (SNR) and bit-error rate
(BER). The many ways to specify, measure, and characterize receiver noise
performance can sometimes lead to confusion and misinterpretation.
Basics of Receiver Noise It is useful to first recognize there will always be some minimum amount of
noise to contend with, due to the natural environment and is independent of the
receiver itself. Because of thermal agitation of charged particles, nearly
everything around us radiates radio waves. Although extremely weak this
radiation may be detected by a sensitive receiver. For wireless receivers, the
principle source of natural radiation is the ground, atmosphere, and the sun.
Because of temperature dependence, the noise collected and presented to the
receiver can be influenced by the direction the receive antenna is pointing. For
instance, the thermal radiation collected by an antenna pointing to a cool
night-filled sky will be less than if pointed to the warm earth.
In receiver design, it is customary to represent the antenna and the
assemblage of naturally occurring noise sources preceding the receiver as a
single resistive noise source, with noise voltage (Reference 1)
In an ideal world circuits would consume
no power, create no noise and system dynamic range would be infinite.
Fortunately for circuit designers who like challenges, this is not the case.
Instead, the task is to design systems that will come as close to the ideal as
possible. This usually requires many complex tradeoffs in order to optimize to a
particular requirement.
where k is Boltzman’s constant (1.38 x 10⁻²³) and T is the “equivalent noise temperature”, Reference 2. The term T becomes quite complex as it is coupled to the environmental mechanisms discussed previously, and the antenna’s parameters at that moment in time.
To allow the design and comparison or receivers independent of the antenna and environment a simplification is made where the equivalent noise temperature is set to 290 K. Using a receiver with matched-impedance front end (the usual goal) allows one to speak of the available noise power from the source, and presented to the receiver input. Figure 1 shows a simplified system model for a superheterodyne receiver, including source noise.

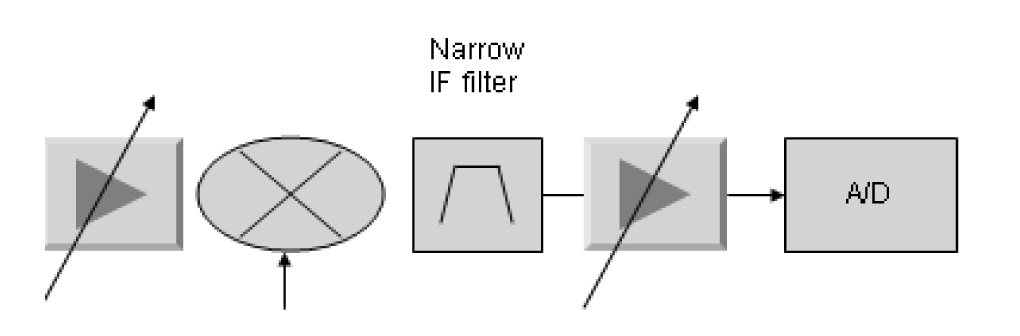
Figure 1. (top) A simplified receiver system—input stage; (below) The remainder of the receiver input channel.
(Eq. 1) Nsa = Vna2/Rs
= kTB =
1.38 x 10-23 · 290 · B
= 4.00 x 10⁻²¹ · B
where
vna = vns/2; vns = Johnson noise voltage for a
resistor; and B is the bandwidth under consideration
Two common logarithmic forms for Nsa that often appear are:
(Eq. 2) Nsa (dBm) = 10 log (4 x 10-21/1 x
10-3) + 10 log (B)
= -174 + B (in dB)
(Eq. 3) Nsa
(dBm) = 10 log (4 x 10-21/1 x 10-3)
+10 log (1 x
106) + 10 log (B) (in MHz)
= -114 + B
(note that in Equation 3 differs from Equation 2, in that it assumes B is
entered in MHz, not Hz).
Assuming that the receiver is noiseless, and its cumulative gain is G (in
dB), the noise No appearing at the output is given by:
(Eq. 4) No (dBm) = Nsa + G = -174 + 10 log (B) +G
where B is the receiver noise BW as set by IF filter in Figure 1.
There are several observations to be made about these expressions and how
they are applied:
Thus far, the noise into and out of an ideal receiver has been discussed, as has the dependence on bandwidth. It is now appropriate to bring the receiver's self-generated noise into the discussion.
The performance of a noisy receiver may be judged by comparing its output
noise to the noise that would be expected by a noiseless receiver:
(No (in dBm) = Nsa (in dBm) + G (in dB).
The output of the noisy receiver will be determined by the noise available from the source, the gain of the receiver and the addition of noise generated by circuits within the receiver. The noise performance may also be gauged at the input of the receiver where individual noise sources within the receive circuits are referred to and power combined at the input. The advantage of this method is that it allows the noise performance of receivers with differing gain to be compared without having to consider the gain difference.
Noise Figure (NF) is probably the most commonly used Figure-of-Merit quantifying receiver noise performance. NF can be calculated as the ratio of the sum of the available source and receiver input referred noise power to the available source noise expressed in dB.
(Eq. 5) NF (dB) = 10 log (Nsa + Ni)/Nsa) = 10 log (1+Ni/Nsa) = 10 log (F)
Where:
F= (1+Ni/Nsa) = Noise Factor and
Ni is the equivalent input referred noise power of the noisy
receiver.
For a noiseless receiver, Ni = 0, noise factor F=1 and NF=0 dB. Typical noise figures for practical receivers are in the range of ~2 to 10dB depending on power, supply voltage, process and circuit design. A receiver whose spot NF is 3 dB has an input noise power, Ni that is equivalent to available noise power of the source, or kT.
The equivalent input noise voltage for a particular NF is dependent on the
receiver front-end system impedance. The spot noise voltage (V/√Hz) may be
calculated from the NF by:
NF = 10 log (1+ (Vni2/Rs/Nsa)
when NF = 3dB, Vni = √(Nsa · Rs ) = √(kT
Rs) = 4.5nV/√Hz This small value of noise voltage corresponding to
3-dB NF demonstrates why low-noise receivers are challenging to implement. This
also explains why impedance transformation circuits (effectively an auto
transformer) have value in LNA design!.
The sum of the source available noise power, Nsa, and input
referred noise of the receiver, Ni, defines the receiver’s noise
floor:
(Eq. 7) Noise floor (dBm) = 10 log (Nsa + Ni) = NF + 10 log Nsa = Nsa (dBm) + NF = -174 + B (in dB) + NF
For the signal to be detected, it must be higher than the noise floor (6). For this reason, the term minimum discernable signal (MDS) is often used interchangeably with noise floor. However, some references take the MDS to be 3 or more dB higher than the receiver noise floor.
The system designer usually specifies a carrier-to-noise ratio requirement for the receiver. This leads to the definition of sensitivity, which is the input noise floor plus the required CNR.
(Eq. 8) Sensitivity (dBm) = Noise Floor + CNR
= -174 + 10 log B + NF +
CNR
The sensitivity is the minimum signal level at the receiver input that will meet the CNR of the system, using a receiver of specified noise figure. It is difficult to infer the relative performance of receivers designed for different communications standards by comparing sensitivities alone. System bandwidths and CNR differences may be significant so must also be considered.
SNR, BER & EVM
Of all the parameters mentioned thus far, the
most important to the system designer are probably SNR and BER. The SNR is
calculated as a ratio of signal power to the noise power occupying a defined
bandwidth. If the signal was a simple sine wave, then SNR = CNR. Working with
CNR is preferable to the circuit designer, as sine-wave carrier -level
requirements relate more easily to the circuit-block design.
Translation of SNR for a complex signal to an adequate CNR requirement is possible. This translation depends greatly on the complexity of the signal modulation and the type of detector used. A specific example involving FM and a particular FM demodulator is shown in Figure 2 where the horizontal axis is input CNR to the detector and the vertical axis is the resulting SNR of the FM demodulated signal. In this system, a 36 dB demodulated FM SNR is equivalent to specifying 10 dB CNR.

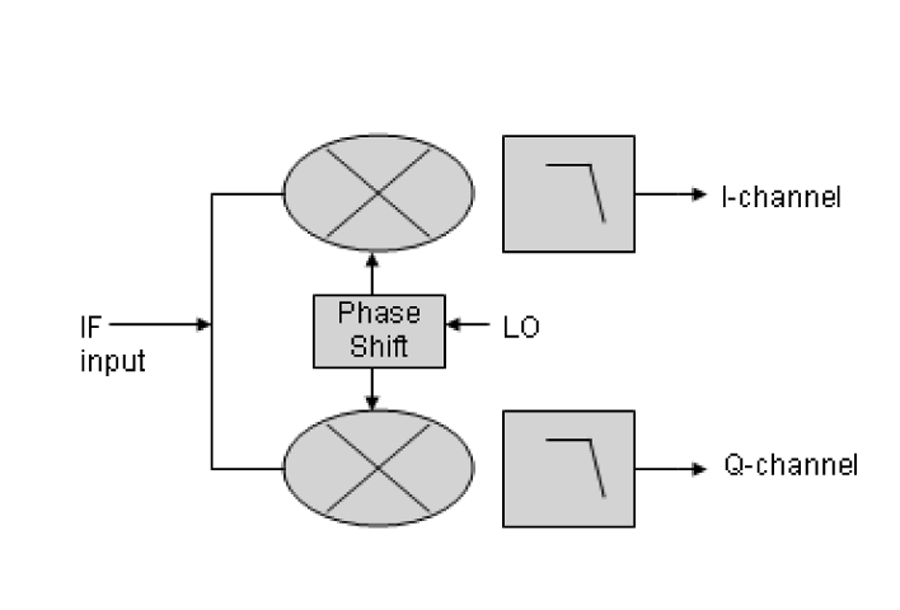
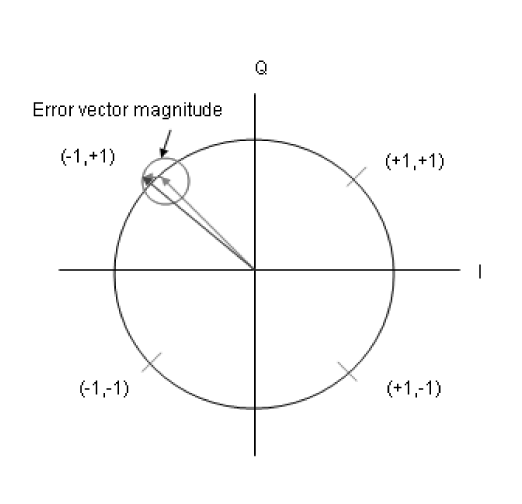
Another noise-related specification associated with digital-based modulation schemes, such as QPSK or QAM, is error vector magnitude (EVM). This is a specification usually applied at the output of the I/Q demodulator found in such systems.
The demodulated signals on I/Q outputs are of the form of (distorted) digital data streams with normalized amplitudes of plus and minus 1 (+1,-1). The valid states are shown as a constellation diagram as in Figure 3.
Other noise sources
There are other noise sources that must also be
considered in receiver design. These include the 1/f noise inherent in all
active devices. There are several mechanisms by which 1/f noise may contribute
to SNR reduction in the receiver. If the 1/f noise is high enough, then the
equations used to calculate sensitivity and other factors must modified, since
they are based on the assumption of white noise that has constant power over the
receiver bandwidth.
This problem often crops up in the baseband circuits of CMOS radios where the 1/f contribution is strong. The synthesizer used to generate the local oscillator can also be corrupted by the 1/f noise and this, too, can degrade the SNR of the receiver. Image noise (via the RF mixer), spurious noise from the synthesizer, and inter-modulation products are all sources of noise or interference that need to be considered.
References
1. J.B. Johnson, Thermal Agitation of Electricity in
Conductors”, Physics Review,. 32 (July 1928), pp. 97-109.
2.
Principles of Noise, J. Freeman, 1958, Wiley & Sons.
3.
Communication Receivers, U Rohde & T Bucher, 1998, McGraw Hill
4.
The Design of CMOS Radio Frequency Integrated Circuits, T. Lee, 1998,
Cambridge University Press
About the author
Ken Faison is the vice president of
engineering at Integrated Circuit
Designs. He has over 20 years of experience in wireless and wireline
transceiver design. He can be reached at kfaison@ic-designs.com
Источник статьи: http://www.commsdesign.com/design_corner/showArticle.jhtml;jsessionid=GZ4DAGD2MEYNEQSNDBESKHA?articleID=188101578