Source: http://www.ifm.eng.cam.ac.uk

| Library | Personal page |
| Đóńńęčé | Ŕíăëčéńęčé |
Source: http://www.ifm.eng.cam.ac.uk |
|
Huw Richards, |
The basic principles for the Total Quality Management (TQM) philosophy of doing business are to satisfy the customer, satisfy the supplier, and continuously improve the business processes.
Questions you may have are:
Satisfy the customer
The first and major TQM principle is to satisfy the customer-the person who pays for the product or service. Customers want to get their money's worth from a product or service they purchase.
Users
If the user of the product is different than the purchaser, then both the user and customer must be satisfied, although the person who pays gets priority.
Some top companies not only provide quality products, but they also give extra service to make their customers feel important and valued.
Chain of customers
Often in a company, there is a chain of customers, each improving a product and passing it along until it is finally sold to the external customer. Each worker must not only seek to satisfy the immediate internal customer, but he or she must look up the chain to try to satisfy the ultimate customer.
Satisfy the supplier
A second TQM principle is to satisfy the supplier, which is the person or organization from whom you are purchasing goods or services.
External suppliers
A company must look to satisfy their external suppliers by providing them with clear instructions and requirements and then paying them fairly and on time.
It is only in the company's best interest that its suppliers provide it with quality goods or services, if the company hopes to provide quality goods or services to its external customers.
Internal suppliers
A supervisor must try to keep his or her workers happy and productive by providing good task instructions, the tools they need to do their job and good working conditions. The supervisor must also reward the workers with praise and good pay.
Get better work
The reason to do this is to get more productivity out of the workers, as well as to keep the good workers. An effective supervisor with a good team of workers will certainly satisfy his or her internal customers.
Empower workers
One area of satisfying the internal suppler is by empowering the workers. This means to allow them to make decisions on things that they can control. This not only takes the burden off the supervisor, but it also motivates these internal suppliers to do better work.
Continuous improvement
The third principle of TQM is continuous improvement. You can never be satisfied with the method used, because there always can be improvements. Certainly, the competition is improving, so it is very necessary to strive to keep ahead of the game.
Working smarter, not harder
Some companies have tried to improve by making employees work harder. This may be counter-productive, especially if the process itself is flawed. For example, trying to increase worker output on a defective machine may result in more defective parts.
Examining the source of problems and delays and then improving them is what is needed. Often the process has bottlenecks that are the real cause of the problem. These must be removed.
Worker suggestions
Workers are often a source of continuous improvements. They can provide suggestions on how to improve a process and eliminate waste or unnecessary work.
Quality methods
There are also many quality methods, such as just-in-time production, variability reduction, and improve processes and reduce waste.
Conclusion
The principles of Total Quality Management are to seek to satisfy the external customer with quality goods and services, as well as your company internal customers; to satisfy your external and internal suppliers; and to continuously improve processes by working smarter and using special quality methods.
TQM Tools
Here follows a brief description of the basic set of Total Quality Management tools. They are:
Pareto Principle
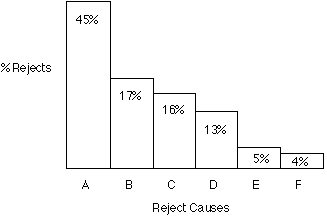
The Pareto principle suggests that most effects come from relatively few causes. In quantitative terms: 80% of the problems come from 20% of the causes (machines, raw materials, operators etc.); 80% of the wealth is owned by 20% of the people etc. Therefore effort aimed at the right 20% can solve 80% of the problems. Double (back to back) Pareto charts can be used to compare 'before and after' situations. General use, to decide where to apply initial effort for maximum effect.
Scatter Plots
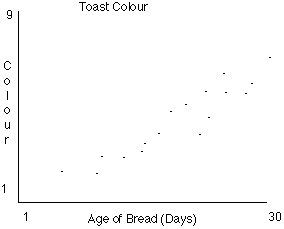
A scatter plot is effectively a line graph with no line - i.e. the point intersections between the two data sets are plotted but no attempt is made to physically draw a line. The Y axis is conventionally used for the characteristic whose behaviour we would like to predict. Use, to define the area of relationship between two variables.
Warning: There may appear to be a relationship on the plot when in reality there is none, or both variables actually relate independently to a third variable.
Cause and Effect, Fishbone, Ishikawa Diagram
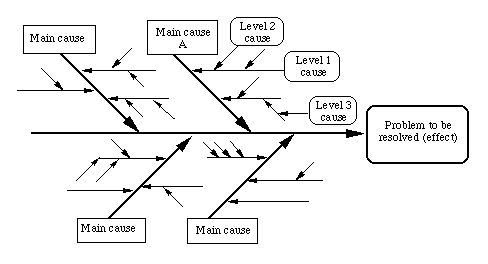
The cause-and-effect diagram is a method for analysing process dispersion. The diagram's purpose is to relate causes and effects. Three basic types: Dispersion analysis, Process classification and cause enumeration. Effect = problem to be resolved, opportunity to be grasped, result to be achieved. Excellent for capturing team brainstorming output and for filling in from the 'wide picture'. Helps organise and relate factors, providing a sequential view. Deals with time direction but not quantity. Can become very complex. Can be difficult to identify or demonstrate interrelationships.
Histogram or Bar Graph
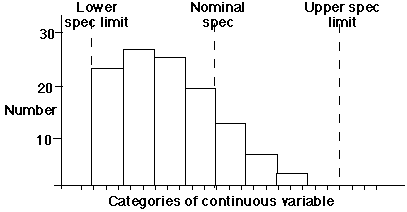
A Histogram is a graphic summary of variation in a set of data. It enables us to see patterns that are difficult to see in a simple table of numbers. Can be analysed to draw conclusions about the data set.
A histogram is a graph in which the continuous variable is clustered into categories and the value of each cluster is plotted to give a series of bars as above. The above example reveals the skewed distribution of a set of product measurements that remain nevertheless within specified limits. Without using some form of graphic this kind of problem can be difficult to analyse, recognise or identify.
| Library | Personal page |