| English | Русский | DonNTU> Master's portal |
|
Biography |
|
||||||||||||||||||||
|
Actuality. Aims and tasks |
Time series forecasting by his current and past values is the important applied task. One of the most widespread methods of prediction consists in extrapolation, I.e. in an extension in the future of tendency, observed in the past. Extrapolation is based on the followings assumptions:
|
||||||||||||||||||||
|
Review of existent researches |
Presently in practical activity economists for the estimation of depth of economic
forecast are use the following dependence:
where L is a period of forestalling, n is an amount of values of forecast, In is a present base of forecast. Such approach for different dynamic series is groundless, as in any way does not take into account high-quality description of base of forecasting, I.e. different degree of shocks, level of shaken, degree of intercommunication of information of initial series (see picture 1). 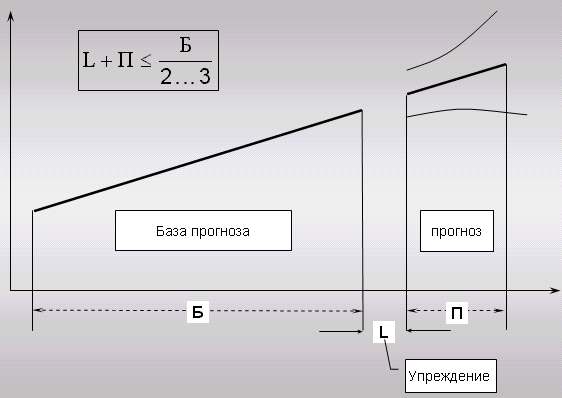
Picture 1 - The estimation of depth of economic forecast
Nevertheless, exactly it is used specialists in area of financial and economic
forecasting.
In [1] the known specialist in area of the strategic planning and forecasting - Fatkhutdinov
Complete absence of clear mathematical ground of depth of forecast western school resists for native researchers. In works [7,8] Jurik M offers approach to determination of optimum depth of forecast through an analysis chaotic components of time series. |
||||||||||||||||||||
|
Scientific novelty |
Offered approach is simple enough and at the same time to the very important instruments for the increase of exactness of economic
forecast and allows to overcome the followings lacks of approaches used presently:
not account of degree of shaken of levels of series round trend;
not account of presence/absence of connection between the levels of series in a base period;
Absence of clear border outside which an economic forecast does not make sense
Offered new approach to the estimation of depth of economic forecast synthesizes quantitative and high-quality descriptions of initial values of dynamic
series and allows grounded from the mathematical point of view to set the period of forestalling for the extrapolated
time series.
Essence offered approach is in the following. For determination of connection between the values of initial
series the selective function of autocorrelation is used. For the construction of this function the method of theory of chances is used for the case of two selections. Temporal lag is characterized by the change of values of initial
time series. In practice size to to limited to the small number of the first values of selective autocorrelation function of 
It is further necessary to find the area of plane, being under to the crooked function. This area characterizes the optimum depth of forecast taking into account the closeness conditions of correlation connection between basic data. That the depth of forecast must not exceed the scopes of meaningful connection of levels of dynamic series. |
||||||||||||||||||||
|
Generalmethodological bases of forecasting |
Extrapolation of trend and intervals of confidences of forecast.
An error, related to its second and third source, can be reflected as a confidence interval of
forecast at adopting some assumptions about property of series. By such interval a point extrapolation
forecast will be transformed in an interval.
Cases are fully possible, when the form of curve, that describe tendency, is chosen wrong or when a progress trend in the future can substantially change and not follow the
those type of curve, which was accepted at smoothing. In last case basic assumption of extrapolation falls short of actual position. The found curve only aligns a dynamic
series and characterizes a tendency only within the limits of period, overcame a supervision. Extrapolation of such trend inevitably will result in an erroneous result, thus an error such can not be estimated beforehand. In this connection it is possible only to mark to, that, presumably, it is necessary to expect
growth of such error (or probabilities of its origin) at multiplying the period of forestalling of
forecast.
One of basic tasks, arising up at extrapolation of trend, consists in
determination of intervals of confidences of forecast. Intuitional clearly, that in
basis of calculation of confidence interval of forecast a measuring device must be fixed
to shaken of series of the looked after values of sign. What higher this shaken, tem
position of trend is less certain in space a "level is time" and the wider owe
to be interval for the variants of forecast at the same degree of trust. Consequently,
question about the confidence interval of forecast it is necessary to begin
with consideration of measuring device
to shaken. Usually such measuring device is determined as middle quadratic
deviations (standard deviation) of actual supervisions from calculations, got
at aligning a dynamic series. In a general view mean quadratic deviation from
trend it is possible to express as:
In a general view a confidence interval for trend is determined as:
If t = I + L, to equalization will be defined by the value of confiding interval for trend, prolonged on L of time units. Confidence interval for a forecast, obviously must take into account a vagueness, related to position of trend not only, but possibility of deviation from this trend. There are cases in practice, when more or less grounded for extrapolation can apply a few types of curves. Thus seasonings are sometimes taken to the following. As each of curves characterizes one of alternative trend, obviously, that space between extrapolated trend it is some natural confiding area for the forecasting size. It is impossible to consent with such assertion. Foremost because each on possible lines of trend answers to some beforehand accepted hypothesis of development. Space between it is unconnected trend with none of them - it is possible to conduct through him unlimited number of trend. It is necessary also to add that a confidence interval is related to some level of probability going beyond his scopes. Space between trends unconnected with no level of probability, and depends on the choice of types of curves. Besides at the prolonged enough period of forestalling it space, as a rule, becomes so substation, that a similar confidence interval is lost by every sense. |
||||||||||||||||||||
|
Got results. Conclusions |
For comparison of quality of decision of tasks of forecasting for traditional and offered approach the intervals of confidences of forecast are used for linear trend. As an example analysis of influencing of high-quality descriptions of time series on the depth of forecast three time series were taken by the dimension of n equal 30 with different variance round trend. In the total calculations of values of area of areas of the crooked selective autocorrelation functions the followings estimations turned out for the optimum depth of forecast: for the bit variance series are 9 levels, for middle variance are 3 levels, for strong variance is a 1 level (Picture 2). 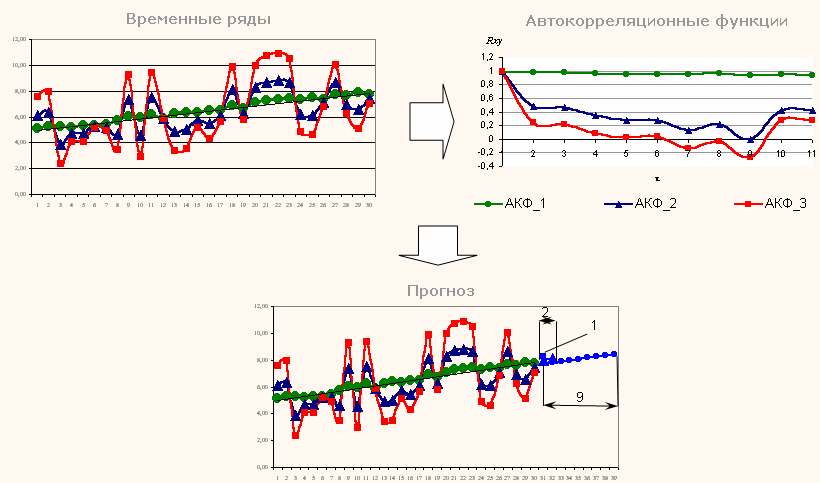 Picture 2
The result
depths of
forecast
Picture 2
The result
depths of
forecast
The analysis of results shows that even at middle shaken of values of series round trend a confidence interval appears very wide (at confiding probability 90%) for the period of forestalling, exceeding calculation by the offered method. Already for forestalling on 4 levels a confidence interval was almost 25% calculation level. Pretty quickly extrapolation results in indefinite in statistical sense results. It proves possibility of application offered approach.
|
||||||||||||||||||||
|
Literature |
|
 . So, the
k-member of autocorrelation function is determined as follows:
. So, the
k-member of autocorrelation function is determined as follows:
DonNTU | Master's portal Biography