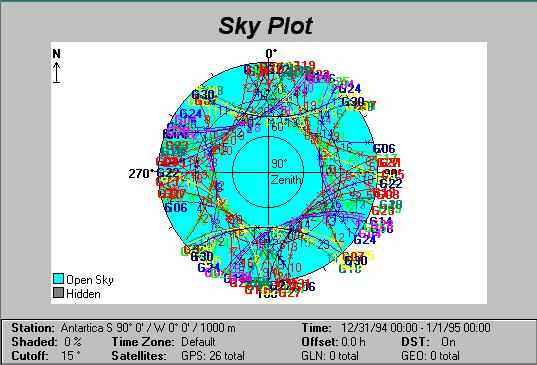
Figure 1. An example of a GPS skyplot.
To schedule a GPS survey the following factors need to be taken into account:
Figure 1. An example of a GPS skyplot.
Skyplots can be used during reconnaissance to ensure that the satellite signals from the selected satellites can be acquired by the receiver. The obstructions at a site can be plotted on a zenith plot independently of a skyplot as in Figure 2 (or a photograph of the zenith could be taken with a fish-eye lens!), and during the survey planning stage a decision can be made on which satellites to be tracked at the sites by comparing Figures 1 and 2 (remembering that only common satellites between sites are useful!). Skyplots annotated with possible obstructions are also useful during actual data tracking because if the data quality is poor (as indicated by the signal-to-noise ratio displayed by the receiver during operation), the possible source of interference can be identified and an appropriate note made to assist subsequent data processing.
Figure 2. Plotting signal obstructions on a skyplot format.
How to best use skyplots during reconnaissance? While GPS manufacturers software can generate the plots, it is not convenient to go into the field with a computer and printer! A compromise is therefore to use a manual method based on a series of skyplots (generated for a representative site such as the centroid of the network), for each hour. At each site the obstructions can then be mapped, and if there are a significant number of potential signal obstructions, they may be visually compared with the various one hour skyplots and the best tracking period selected (that with the minimum obstructions).
How may the obstructions be mapped during reconnaissance? The basic tools are a compass and a clinometer, and every field party should be equipped with them. However, if the site location has not yet been fixed with certainty, as may be the case with sites in urban environments, the reconnaissance assumes greater importance. As there may be many candidate locations for each site, some shortcut techniques should be considered. For example, keep several graphs handy that relate distance to and height of a potential obstruction, to the elevation angle that it subtends (see Figure 3). Efficient reconnaissance techniques can be developed if the heights of buildings and trees are known, and distances are easily measured using, for example, a handheld laser rangefinder.
 |
 |
The pattern of signal obstructions at a site is very sensitive to the
height of the antenna. By increasing the height of the antenna in urban
areas using some form of telescopic pole, the extent of signal obstruction
may be greatly reduced, as dramatically indicated in Figure 4 below.
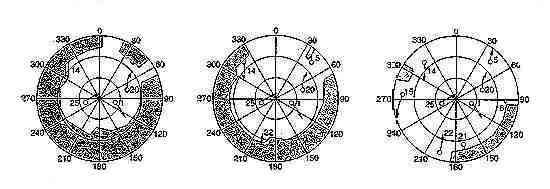
Figure 4. A sequence of skyplots showing obstruction masks and groundtracks
of visible satellites for antenna heights of 1.5, 5 and 10m respectively.
Note the number of visible satellites increases from four (at an antenna
height of 1.5m) to nine (at an antenna height of 110m).
When preparing skyplots the following factors should be kept in mind: