An application to real GDP forecasting
A Complementary Approach to Linear Regression Models
By Steven Gonzalez
Working Paper 2000-07
- The linear regression model.
- The neural network equivalent.
- Producing forecasts.
- Relative forecasting performance.
An empirical example is perhaps the best way to illustrate the differences
between a neural network and a linear regression model. A neural network has
therefore been constructed to forecast quarterly growth of Canada's real GDP.
This model is compared to a linear regression model developed in the Department
of Finance by Lamy (1999). To facilitate the comparison, the neural network
uses exactly the same explanatory variables and the same sample period as the
linear regression model. Any differences in the results can therefore be
attributed solely to the estimation procedure.
The linear regression model.
Lamy (1999) has developed an accurate model for one-quarter ahead forecasts of quarterly growth of Canada's real GDP. The model has performed very well, both in-sample and out-of-sample. Over the period from 1978Q1 to 1998Q2, his model explains 82 per cent of the variance of real GDP growth. The estimated coefficients are also very stable when the model is estimated over different sample periods. In addition, the model is quite parsimonious, as it contains only the following six explanatory variables (with their abbreviation in parenthesis):
- The quarterly growth rate of Finance Canada's index of leading indicators of economic activity (one-quarter lag) ( Lt-1 )
- Employment growth (contemporaneous) ( Et )
- Employment growth (one-quarter lag) ( Et-1 )
- The Conference Board's index of consumer confidence (contemporaneous) ( Ct )
- The first difference of the real long term interest rate (nine-quarter lag) ( Rt-9 )
- The first difference of the federal government budgetary balance as a share of GDP(three-quarter lag) ( Ft-3 )
Four dummy variables were added to control for four quarters considered as outliers (The four quarters in question are 1980Q3, 1981Q1, 1986Q4 and 1991Q3). For the purposes of the present illustration and in order to leave some data for out-of-sample forecasts, the linear regression model was estimated using data from 1978Q1 to 1993Q2 (62 observations). The estimation results are given in equation (1):
GDPt = -1.695 + 0.075•Lt-1 + 0.304•Et
+ 0.251•Et-1 + 0.019•Ct - 0.175•Rt-9
- 0.320•Ft-3 - 1.155•D1 + 1.168•D2 - 0.906•D3
- 0.843•D4 + et (1) ,
where D1, D2, D3 and D4 are the dummy variables and et is the residual term. All coefficients are significantly different from zero at a confidence level of 95 per cent.
The neural network equivalent.
Determining the number of inputs and outputs of the network is a straightforward process. The linear regression model above has six regressors and four dummy variables. Our neural network will therefore contain ten inputs. Since we have only one dependent variable, the network will have a single output. As explained in Section 2.2, the number of hidden units to include in the network is largely the result of trial and error. For the present illustration, an architecture with only two hidden units was selected. Although this architecture is probably too simplistic to capture the complexity of the problem at hand, its simplicity will facilitate the comprehension of the dynamics of the model. The purpose of this section is thus to present a concrete example of a network, not to develop a high-performance forecasting tool. Hence, the network presented here should not be considered as the best possible model that neural networks could offer.
Figure 9 illustrates the architecture of the network. This is a
fully connected network, i.e. all inputs are connected to all hidden units.
Bias terms have been included for both the hidden units ( Bias
The early stopping procedure was used to estimate the 35 weights of the network (The neural network literature suggests that rescaling the data is often beneficial to improve forecasting accuracy because the estimation algorithms tend to perform better when the input values are small and centred around zero. In the network presented here, only the Conference Board index of consumer confidence was modified by dividing all values by 100. Therefore, the base value of the index is 1 instead of 100.) In order to implement this procedure, the sample was divided into three separate parts: a training set (1978Q1 to 1993Q2), a validation set (1993Q3 to 1995Q4) and a test set (1996Q1 to 1998Q2). The training set, which correspond to the in-sample period of the linear regression model in equation (1), is the only portion of the data that the training algorithm used to estimate the network weights.
Figure 9

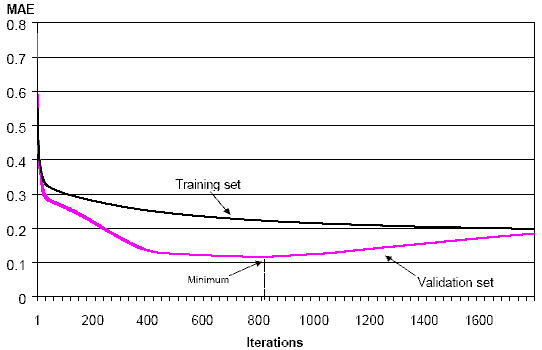
Figure 10 illustrates the evolution of the mean absolute error (MAE) (The software used to estimate the network weights (MATLAB with the Netlab toolbox) was programmed to provide the mean absolute forecasting error, rather than the mean squared error as discussed in Section 3. This does not have a significant effect on the results. The Netlab toolbox can be downloaded free of charge from http://www.ncrg.aston.ac.uk/netlab/index.html.) in the training and validation sets throughout the iteration process. The MAE in the validation set reaches a minimum after 819 iterations, while the MAE in the training set continues to decline continuously. To reduce the risk of overfitting the network, the procedure was therefore stopped after 819 iterations, with a MAE of 0.118 in the validation set.
Figure 10
In Figure 11, the estimated weights are presented for various sections of the network. The connections from the inputs and BiasH to the hidden unit H1 are presented in Panel A. Panel B presents a similar diagram for the connections between the inputs and H2. Panel C displays the estimated weights between the hidden units and the output unit and Panel D illustrated the direct connections from the inputs to the output.
Figure 11

Producing forecasts.
Suppose we want to produce a forecast of real GDP growth for 1998Q2. The values of the regressors/inputs for 1998Q2 are given below:
Lt-1 = 0.66, Et = 0.67, Et-1 =
0.75, Ct = 1.1497, Rt-9 = 1.13, Ft-3 = 0.84,
D1 = D2 = D3 = D4 = 0.
In the case of the linear regression model, the forecast for 1998Q2 is straightforward:
GDPt = -1.695 + 0.075•(0.66) + 0.304•(0.67) +
0.251•(0.75) + 0.019•(1.1497) - 0.175•(1.13)
- 0.320•(0.84) - 1.155•(0) + 1.168•(0) - 0.906•(0) - 0.843•(0) = 0.46 (2)
The linear regression model forecasts real GDP growth of 0.46 per cent in 1998Q2. Actual real GDP growth in 1998Q2 was 0.44 per cent.
In the neural network, the first step consists in calculating the value of the hidden units. To obtain a value for H1, the network must first multiply the value of each input by the corresponding weight, as depicted in Panel A of Figure 11. This value is denoted Z1.
Z1 = -0.401 - 0.058•(0.66) + 0.292•(0.67) -
0.207•(0.75) + 0.550•(1.1497) + 0.754•(1.13)
+ 0.294•(0.84) - 1.038•(0) + 0.487•(0) - 0.290•(0) - 0.209•(0) = 1.332 (3)
The value of H1 is obtained by inserting Z1 into the hyperbolic tangent activation function:
H1 = TANH(1.332) = ( eZ1 - e-Z1)
/ ( eZ1 + e-Z1)
= ( e1.332 - e-1.332) / ( e1.332 + e-1.332)
= 0.8697 (4)
In a similar fashion, using the weights in Panel B of Figure 11, H2 can be shown to equal:
H2 = TANH(-0.6999) = ( e-0.6999 - e-(-0.6999)) / ( e-0.6999 + e-(-0.6999)) = -0.643 (5)
Using the analogy of the human brain and remembering that the values produced by the hyperbolic tangent function are bounded between –1 and 1, it could be said that the neuron H1 is being strongly stimulated by the specific stimuli provided by the input values, while H2 is moderately stimulated.
The output unit GDPt has an identity activation function, meaning that the hyperbolic tangent function will not be used to process the linear combination of the "stimuli" reaching the output unit. The network's forecast will simply be equal to the linear combination of the hidden units (panel C of Figure 11) and the inputs (panel D):
GDPt = -0.081 + 1.45•H1 + 0.604•H2
+ 0.084•Lt-1 + 0.335•Et + 0.751•Et-1 + 0.339•Ct
- 1.067•Rt-9 - 0.649•Ft-3 + 0.048•D1 + 0.21•D2
- 0.256•D3 - 0.55•D4 (6)
Evaluating this equation with the values for 1998Q2 yields:
GDPt = -0.081 + 1.45•(0.8697) + 0.604•(-0.6043) +
0.084•(0.66) + 0.335•(0.67) + 0.751•(0.75) + 0.339•(1.1497)
- 1.067•(1.13) - 0.649•(0.84) + 0.048•(0) + 0.21•(0) - 0.256•(0) - 0.55•(0) =
0.30 (7)
The network therefore forecasts real GDP growth of 0.30 per cent for 1998Q2, which is considerably less accurate than the linear model's forecast. Obviously, the calculations required to make a forecast using a neural network are significantly more complex than in the case of a linear regression model. Fortunately, these calculations can be executed instantaneously by the same software that estimated the network weights.
Equation (6) clearly illustrates how the augmented neural network encompasses the linear regression model. If the second and third terms of the right-hand side of this equation are removed, equation (6) becomes a simple linear combination of the inputs. These two terms, which are nonlinear transformations of the inputs, help the network to capture nonlinear relationships among the variables. If the network had not detected any nonlinearities in the data generating process, the estimated weights for H1 and H2 would have been zero and the network would have become a standard linear regression model. In the current example, the non-zero values of the weights for H1 and H2 suggest the presence of some nonlinearities.
Relative forecasting performance.
Is all this computational effort worthwhile? A comparison of the forecasting accuracy of both methods provides some insight into this question. Table 1 compares the forecasting performance of this neural network and the linear regression model for one-quarter ahead forecasts. Three common criteria were used to compare the two models: the mean absolute error, the mean squared error and the Theil inequality coefficient. The table suggests that the network was more accurate than the linear regression model, both in-sample and out-of-sample. The network reduced the forecasting errors by between 13 and 25 per cent for the in-sample period and by 20 to 40 per cent for out-of-sample forecasts.
Table 1
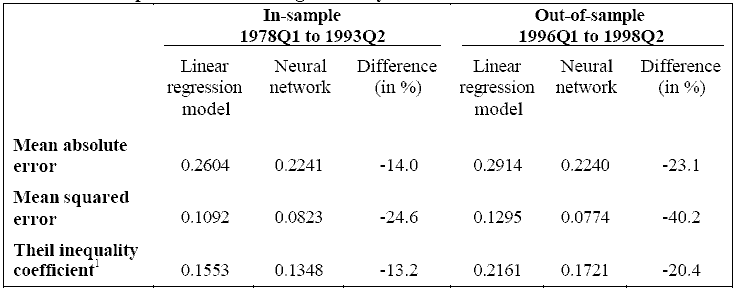
1. The Theil inequality coefficient is bounded between 0 and 1. The value of the coefficient approaches zero as forecasting accuracy increases.
From a theoretical point of view, this result is not too surprising. Given that an augmented neural network encompasses the linear regression model, the network should not, in theory, perform worse than a linear model. Two factors could nonetheless have led the network to perform worse than the linear model. First, the optimizing algorithm could have remained trapped in a local minimum that was far from the global minimum. To avoid this problem, the network weights were re-estimated using 800 sets of random starting values. The network with the greatest accuracy in the validation set was retained. Second, the network could have overfit the data despite the use of the early stopping procedure. When the number of observations in the training and validation sets is small, overfitting might still occur when using the early stopping procedure. This does not seem to have occurred in the current example, given the relatively good out-of-sample forecasting performance of the network.
Four statistical tests were used to assess whether the improvement in forecasting accuracy was statistically significant: Wilcoxon's signed-rank test, a non-parametric sign test, the Diebold and Mariano (1995) test and the Ashley, Granger and Schmalensee (1980) test. In each of these tests, the null hypothesis postulates that the forecasting accuracy of both models is the same. All tests were two-tailed and were applied to the mean squared error and the mean absolute error. The results, which are summarized in Table 2, suggest that there is only limited evidence that the improvement in forecasting accuracy was statistically significant. At a 90-per-cent level of confidence, the null hypothesis could only be rejected in four or five of the fourteen possibilities presented in the table. Although the point estimates in Table 1 suggest that the neural network outperformed the linear model, the standard deviations of the test statistics were too large to conclude that the improvement was statistically significant.
Table 2
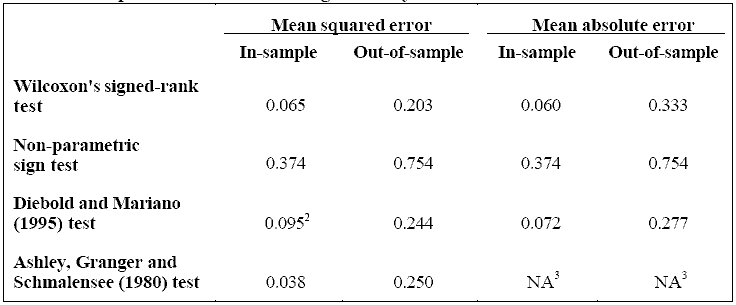
1. The significance level (p-value) provides the probability of
observing a given difference in forecasting accuracy between the two models, if
the null hypothesis is true (i.e. both models have the same accuracy).
2. The Diebold and Mariano test might not be accurate for the in-sample mean
squared error because this test requires that the difference in the MSE between
both models have a normal distribution. A Jarque-Bera test on the in-sample MSE
differential led us to strongly reject a normal distribution.
3. The Ashley, Granger and Schmalensee test only applies to the mean squared
error.
Additionally, forecast encompassing tests (cf. Chong and Hendry, 1986) were conducted for both the in-sample and out-of-sample periods. The results did not allow us to reject the null that neither model encompassed the other. Hence, based on all our tests, we cannot conclude that the improvement in forecasting accuracy is statistically significant.
The neural network developed in this section should be viewed as a complement to the linear regression model, rather than a substitute, because it used the explanatory variables of the linear model as a starting point. Although this may seem like a trivial point, it is in fact very important. The computational effort required to design a neural network makes it virtually impossible to build the model from scratch, without the help of a linear regression model. As explained in Section 3.2 (cf. Figure 8), the design of a neural network is a lengthy process of trial and error. For a given set of explanatory variables and a given network architecture, a neural network must be re-estimated hundreds or thousands of times with different sets of starting values in order to avoid a local minimum (In the current example, a Pentium 350 MHz took about 25 hours to re-estimate the network with 800 sets of starting values). This entire process of re-estimation must be repeated for each different network architecture under consideration before a conclusion can be made as to the out-of-sample forecasting accuracy associated with a given set of explanatory variables. Thus, each time a change is made to the set of explanatory variables, the network must be re-estimated under several different architectures, each one requiring several hundreds or thousands of starting values. This process would be much too long if it were followed to the letter.