Èñõîäíûé òåêñò äàííîé ñòàòüè íàõîäèòñÿ ïî URL: http://stroke.ahajournals.org/cgi/content/full/31/8/1921


An Objective Characterization of Atherosclerotic Lesion

An Alternative Method to Identify Unstable Plaque

Sayed Aly, PhD, FRCS; Christopher C. Bishop, MCh, FRCS

Stroke 2000;31;1921-1924

Stroke is published by the American Heart Association. 7272 Greenville Avenue, Dallas, TX 72514

Copyright © 2000 American Heart Association. All rights reserved. Print ISSN: 0039-2499. Online ISSN: 1524-4628


Background and Purpose—The aim of this study was to evaluate a computer-assisted technique to characterize atherosclerotic plaque.

Methods—In 9 subjects (7 men, 2 women; mean age 33 years), known anatomic areas (carotid, fat, muscle, iliotibial tract, and tibia) were scanned with an Acuson duplex ultrasound machine with 72 machine settings. The ultrasound images of these anatomic areas were recorded on magneto-optical disks. Echo amplitude statistics were obtained, and the mean pixel value (MPV) was used to assess the level of echogenicity. The ideal settings of this particular scanner for optimal discrimination between these tissues types were identified by the Heuristic Index of Discrimination. With these settings, carotid artery scanning was performed on 17 patients (15 men, 2 women; mean age 65 years), and the image analysis of their ultrasound carotid plaques was compared with their histological findings.

Results—In this study, discrimination between the selected tissues was found to be optimal when the controls were set at log 40 dB, 0/2/0, and gain of 25 dB. The MPV of the carotid specimens scanned at this setting correlated significantly with the histological findings (Spearman correlation, P=0.002).

Conclusions—Computer-assisted image analysis to give the MPV is a technique that may be used to identify unstable atherosclerotic plaques reliably. (Stroke. 2000;31:1921-1924.)

Key Words: atherosclerosis, image processing, computer assisted


The use of B-mode pulsed echo imaging to identify the vessel wall was first introduced by Olinger [1]. Plaque structure has been demonstrated as an important factor in the development of embolic events[2]; therefore, characterization of carotid plaque in asymptomatic patients may allow the prediction of risk of a subsequent cerebral event.

Despite the advances in ultrasound imaging in many applications, plaque characterization has remained a subjective process that is observer dependent. Consequently, the value of the Gray-Weale classification[3] has been questioned because it is observer dependent and subject to errors that may arise from different settings of the ultrasound scanner, and it could be improved by application of modern image processing.

It has been demonstrated [4] that digital image processing enables the maximum information from such images to be obtained. Every image consists of a range of shades of color and intensity. In digital images, numbers are used to express the displayed brightness. Each pixel is typically stored as an 8-bit byte giving a representation of 1 of 256 shades of gray; the brightness is represented by the value 0 for black and 255 for the brightest white spot.[5–8]

In computer-assisted image analysis, many statistical processes can be used (see Figure 1). Use of computerized image processing has been described previously in radiological diagnosis[9– 13] to evaluate ultrasound images and correlate statistics with various pathological conditions.

In the present study, image statistics have been used to evaluate plaque morphology[4]. The mean pixel value (MPV) of the echoes from the plaque was used as an index of echogenicity, and its value as a measure to characterize atherosclerotic plaque was assessed.

Subjects and Methods

Instrumentation

An Acuson duplex machine 128 XP/10 duplex scanner (Acuson 1220) was used. An Apple Macintosh computer was connected to the Acuson ultrasound machine. The Adobe Photoshop 3.0.4 program (Adobe System Inc) was used. The area of interest was selected and the image analyzed. MPV and a histogram were obtained (see Figure 1). The specimen tank for ultrasound imaging of excised atheromatous plaques was made of acrylic sheets in which the carotid plaque could be mounted and scanned. Finally, a personal computer was connected to a CCD camera (Microscope-Nikon Labophot-2 camera, JVC TK-1281) installed on a microscope (Olympus) and supported with a Lucia image-analysis computer program (version 3.52a, laboratory imaging for Nikon UK).

Clinical Studies

There are a number of user-adjustable variables on ultrasound machines that affect the image. The exact nature of the processing involved varies from machine to machine. The settings on the Acuson machine were investigated to determine which gave the greatest differentiation between a selection of tissues, so that appropriate standardized settings could be used to ensure that all data from the in vitro study were consistent. Optimum values were estimated by a Heuristic Index of Discrimination (HID; see Statistics). The controls in the Table were optimized.


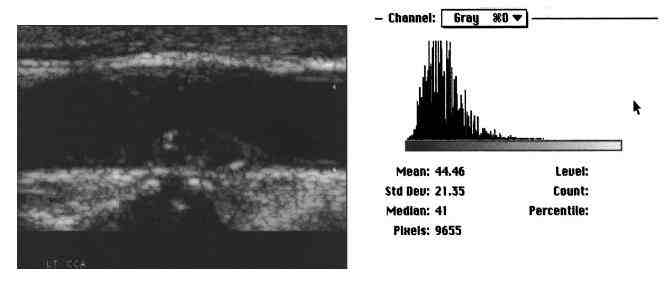
Figure 1. Image analysis of carotid plaque. This figure demonstrates atherosclerotic carotid plaque and the image histogram and statistics.

Nine healthy subjects (7 men and 2 women; mean age 33 years) who had no history of connective tissue disease and were receiving no treatment for any condition were scanned with the Acuson with a 7-MHz linear array transducer. The following anatomic areas were examined: carotid artery (for assessment of blood), subcutaneous fat (axillary and abdominal), muscle (quadriceps and abdominal), iliotibial tract (for assessment of fibrous tissue), and tibia and skull (for assessment of calcified structures). These structures were scanned while the controls were adjusted and images were acquired for analysis. Each of the anatomic regions was scanned, and the image was recorded at 72 different settings of the ultrasound machine, obtained by adjusting each of the above parameters one at a time. All images were electronically recorded on magneto-optic disks (128 MB). The Adobe Photoshop computer program was used to examine the stored image, the area of interest was selected with the program’s selecting tool, and the MPV of the selected anatomic region was obtained. The optimum setting of the scanner was defined as the setting at which the MPV was best able to discriminate between tissues.

Further study was undertaken to verify the relation between the MPV and the atherosclerotic plaque structure by use of the optimum machine setting. Patients with significant carotid artery stenosis who were scheduled to undergo carotid endarterectomy were scanned before the surgery. Carotid plaques were classified according to Gray-Weale classification. Highly calcified plaques were excluded on the basis of scanning to avoid the effect of acoustic shadowing on image analysis. After endarterectomy was performed, the excised specimens were examined and scanned within 4 hours. All plaques were scanned in both longitudinal and transverse sections with the equipment adjusted at the optimum control settings. The examination started from the cranial end of the plaque and proceeded toward its caudal end. The probe was moved along at 0.5-cm intervals, and transverse images of the plaques were acquired by the computer system and recorded.

The area of interest on the stored images was highlighted to obtain the MPV of the plaque. Each specimen was fixed in formalin-saline 10% for 24 hours. All specimens were anatomically oriented and embedded in paraffin, with the common carotid end at the base and the internal carotid end at the top. Specimens were cut transversely at 0.5-mm intervals along the whole specimen length and stained with elastin van Giessen. Slides were examined by the histology image-analysis system to assess the percentage area of soft materials (fat and blood) and fibrocalcific plaque. The area of histological section occupied by each tissue type was calculated with the aid of the Lucia computer program. To validate the computer-assisted histology image analysis, and to measure the agreement between observers to identify different histological structures, 10% of the carotid histology specimens were reexamined by one of the authors within 6-month intervals, as well as by another independent researcher. Both the intraobserver and interobserver variations were obtained by the Bland and Altman technique[14].

Parameter

Definition and Range Examined

Overall gain

Adjusts gain with respect to the maximum available

Preprocessing

Largely controls enhancement of edges of structures

Persistence

Frame averaging to reduce coherent speckle

Postprocessing*

A compression function to permit the display of a wide echo dynamic range by mapping ranges of echo amplitudes to single shades of gray scale

Log compression

A particular function to map the intensity of the returned echo to different shades of gray scale

Transmit power

The ultrasound power actually emitted in relation to the maximum available on the machine

Transmit zone

Depth of region dynamically focused on transmit

Depth gain compensation†

Compensates for attenuation, the loss in the echo signal strength, as the ultrasound passes through the tissues


In this study, the transmit power was kept at 0 dB to produce the maximum power output, and the preprocessing was kept at zero to avoid introducing high values from edges. Log compression: at 40 to 50 dB or middle range; persistence: at 2 or 3, to obtain some noise reduction by frame averaging; postprocessing: 0, 2, or 6 to assess the effect of the compression; gain at -5, 0, and +5 dB, at single transmit zone and multiple transmit zones.

*For convenience, preprocessing, persistence, and postprocessing values are written for example, as 0/2/0, where the numbers represent respective settings.

†For the in vitro work, attenuation is effectively zero, because the interest was the plaque morphology and a flat depth gain compensation curve is required.

Statistics

The ideal machine setting at which the MPV has the greatest ability to discriminate between various tissues was determined as follows: all tissue types on each of the 9 subjects were scanned at 72 machine settings. The MPV for each setting was obtained, as well as their variances. The variance of these means was calculated (A) and the means of the variance at each setting was calculated (B) with the StatView Statistics computer program.

The HID was calculated for each setting by the equation HID5A/B. The HID represents the ability to discriminate between the various types of tissues. The optimum setting of the machine is that which has the greatest HID to discriminate between blood and fatty tissue as soft materials and fibrocalcific structures. Statistical analysis of the results was performed with the StatView Statistics computer program (version 4.5 for Apple Macintosh, Abacus Concepts, Inc). This study was performed at the vascular laboratory at the Middlesex Hospital, London, UK. The approval of the University College London Hospitals Ethics Committee was obtained, and patients included in the study gave informed consent. Results

In part 1 of this series of investigations, 3240 ultrasound images were recorded of 9 controls (7 men, 2 women). Their MPV was calculated in each selected setup. For each of the ultrasound machine settings, the HID value was detected and plotted on the vertical axis. A fairly small range of settings resulted in favorable levels of discrimination.

Optimum machine settings were at log compression 40 dB, preprocessing 0, persistence 2, and postprocessing 0, with gain of 25 dB. These values gave an HID of 82%. Increasing the machine gain to 0 dB from 25 dB but leaving other parameters unchanged resulted in an HID of 64% whether the persistence setting was 2 or 3. The remaining settings resulted in an HID that ranged between 6% and 42%.

Computer-assisted image analysis for the image recorded at the optimum setup showed that the MPV of the soft tissues (blood, fat, and muscle) was < 50 (blood MPV range 1 to 4, fat 2 to 16, and muscle 1 to 43), whereas that of the fibrocalcific tissues was < 150 (MPV 135 to 200).

In part 2 of this investigation, 17 carotid plaque scans were performed (transient ischemic attacks were reported by 15 patients, whereas 2 were asymptomatic with 99% carotid artery stenosis; these patients were part of the Asymptomatic Carotid Surgery Trial [ACST]). One plaque was found to be grade 1, 5 plaques were grade 2, 8 plaques were grade 3, 3 plaques were grade 4, and none were grade 5.

The MPV was compared with the Gray-Weale classification. The MPV for grade 1 varies from 30 to 90, whereas grade 2 varies between 135 and 171, grade 3 between 140 and 180, and grade 4 between 170 and 223.


Figure 2. Spearman correlation between MPV of the gray scale ultrasound image and histological structures of the carotid plaques. The figure demonstrates that as the fibrocalcific contents of the plaque reach 90% of the plaque, the MPV reading is > 150 (x2 = 9.7, P=0.0025), and as the soft content reaches 40% of the plaque, the MPV reading is < 50.

With Spearman rank correlation (Figure 2), the MPV of whole plaque was significantly correlated with its histological structure (r=0.8, P=0.002; 95% confidence interval for r was 0.91 to 0.5). If the fibrocalcific contents of the plaque reach 90% of the plaque, the MPV reading is found to be > 150 (x2=9.7, P=0.0025), and if the soft content is 40% or more, the MPV reading is < 50. The present study has shown that the MPV of fibrocalcific plaques was > 150 compared with soft plaques, for which it was < 50 (P=0.002).


Figure 3. Bland and Altman statistics used to assess interobserver and intraobserver variation. With this graphical method, the difference between the 2 techniques are plotted against the mean. The horizontal lines are drawn at the mean difference, as well as at the mean difference plus or minus 1.96 times the SD.

With regard to the histological part of this study, Figure 3 demonstrates the interobserver and intraobserver variation, in which there was insignificant difference between observers to identify the plaque structures. The difference between the 2 techniques is plotted against the mean. The horizontal lines are drawn at the mean difference, as well as at the mean difference plus or minus 1.96 times the standard deviation.

Discussion

The North American Symptomatic Carotid Endarterectomy Trial (NASCET)15 and the European Carotid Surgery Trial (ECST)16 have clearly demonstrated that patients with symptomatic 70% to 90% carotid artery stenosis have a substantial risk of ipsilateral ischemic stroke over the next few years. They also highlighted the benefit of surgery in the symptomatic group. Identification of other factors may be of value in predicting the development of embolic events in the cerebral circulation. Duplex ultrasound scanning has the ability to determine the degree of carotid artery stenosis and also plaque structure, which has the potential to identify high-risk patients.

Gray-Weale et al[3] classified carotid plaques on the basis of their ultrasound images into 4 types based on echogenicity, and Geroulakos et al,17 in their modification, added a fifth type (calcified plaque). This fifth type is identified on ultrasound imaging by the presence of “shadows” cast by plaques, attributable to strong absorption of ultrasound energy by this plaque. This type has been excluded in the present study. Gray-Weale et al3 also stated that intraplaque hemorrhage and ulceration were frequently found in type 1 and 2 plaques, whereas type 3 and 4 plaques were more calcified and largely fibrous; this classification was also used by Langsfeld et al.[18,19].

In a histological study, el-Barghouty et al4 scanned patients before surgery and selected the center part of the atherosclerotic plaque (after carotid endarterectomy) for analysis (whole plaque was not assessed). These authors correlated the median of gray-scale image intensity (the ultrasound image was scanned but was not recorded electronically, which caused a loss of resolution of the image) to their histological structure and found that the gray-scale median (GSM) of the ultrasound image decreased as the mean percentage of the fat and hemorrhage increased, whereas it increased as the fibrocalcific material increased. They also reported that in the symptomatic group, GSM decreased as the fat and hemorrhage content increased, whereas in the asymptomatic group, both GSM and fibrocalcific content increased. However, the effect of the surgical manipulation during carotid endarterectomy on plaque architecture may have led to a discrepancy between the center of the plaque in the ultrasound image and that of the carotid specimen.

In the present study, ultrasound images were recorded electronically by the QV 200 image-processing computer. Tissues of known type in a human volunteer were examined (blood, fat, muscle, and fibrous and calcified tissues) with a range of different machine settings. This allowed identification of those settings at which images were obtained in which the computer was best able to differentiate between tissues. All images were analyzed and the image statistics obtained objectively. The MPV of the pixels in the tissue of interest in the image was used as the parameter to identify the echogenicity of the structure. The histological study was designed to test whether the findings in the previous study could be extended to the assessment of the morphology of atheromatous plaques. The findings of computerassisted gray-scale image analysis of these specimens have been verified by the histological findings, and a good correlation has been shown. This study has shown that as the soft (fat and blood) content of the plaque increased, the MPV decreased, and as the fibrocalcific tissue content of the plaque increased, the MPV increased. This relation between the MPV and plaque histology has been found to be significant (P,0.002).

In the future, this work may be extended to involve online image analysis of atherosclerotic plaque characterization (in vivo as well as in vitro) and possibly the investigation of second-order statistics. Also, if future study demonstrates a good correlation between MPV and the Gray-Weale classification, better objective assessment of atherosclerotic plaque will be achieved. Computer-assisted image analysis system is an objective that may be of value in identifying unstable atherosclerotic plaques in the carotid territory. This has the potential to revolutionize the treatment of asymptomatic carotid artery disease.

Acknowledgments

We acknowledge Prof Blackwell, professor of medical physics at University College London, for his support, and Prof Senn, professor of medical physics at University College London, for his support and designing HID statistics.

References

1. Olinger CP. Ultrasonic carotid echoarteriography. Am J Roentgenol Radium Ther Nucl Med. 1969;106:282–295.

2. Lusby R. Plaque characterisation: does it identify high risk group? In: Bernstein E, Callow A, Nicolaides A, Shifrin E, eds. Cerebral Re-vascularisation. London, UK: Med-Orion Publishing Co; 1993:93–107.

3. Gray-Weale AC, Graham JC, Burnett JR, Byrne K, Lusby RJ. Carotid artery atheroma: comparison of preoperative B-mode ultrasound appearance with carotid endarterectomy specimen pathology. J Cardiovasc Surg (Torino). 1988;29:676–681.

4. el-Barghouty N, Nicolaides A, Bahal V, Geroulakos G, Androulakis A. The identification of the high risk carotid plaque. Eur J Vasc Endovasc Surg. 1996;11:470–478.

5. Wegener O. Mathematical principles of the image. In: Whole-Body Computed Tomography. 2nd ed. Boston, Mass: Blackwell Scientific Publications; 1992:3–4.

6. Wegener O. Image reconstruction. In: Whole-Body Computed Tomography. 2nd ed. Boston, Mass: Blackwell Scientific Publications; 1992:5–8.

7. Winters K, Busch D. Image resolution. In: Teach Yourself Photoshop 3.0. New York, NY: MIS Press; 1995:259–281.

8. Strandness DE Jr, Slagsvold E, Morken B, Alker H, Bjordal J. Three dimensional visualisation of peripheral arterial disease. In: Greenhalgh R, ed. Vascular Imaging for Surgeons. London, UK: WB Saunders Co Ltd; 1995: 71–80.

9. Einenkel D, Bauch KH, Benker G. Treatment of juvenile goitre with levothyroxine, iodide, or a combination of both: the value of ultrasound grey scale analysis. Acta Endocrinol Copenh. 1992;127:301–306.

10. Becker W, Frank R, Borner W. The importance of quantitative grey scale analysis of the sonogram in diffuse thyroid disease. Rofo Fortschr Geb Rontgenstr Nuklearmed. 1989;150:66–71.

11. Huber S, Delorme S, Knopp MV, Junkermann H, Zuna I, von Fournier D, van Kaick G. Breast tumours: computer-assisted quantitative assessment with color Doppler US. Radiology. 1994;192:797–801.

12. Zendel W, Wakat P, Fischer G, Treisch J, Langer R. A comparison of the quantified determination of the echogeneity of the liver by ultrasound and the density of the liver by CT [in German]. Rontgenblatter. 1989;42:114–117.

13. Hess CF, Wolf A, Kolbel G, Kurtz B. Subjective evaluation and quantitative gray-scale analysis in the sonographic diagnosis of diffuse changes in the liver parenchyma [in German]. Rofo Fortschr Geb Rontgenstr Nuklearmed. 1986;145:140–144.

14. Bland M, Altman D. Statistical methods for assessing agreement between two methods of clinical measurement. Lancet. 1986;1:307–310.

15. North American Symptomatic Carotid Endarterectomy Trial Collaborators. Beneficial effect of carotid endarterectomy in symptomatic patients with high-grade carotid stenosis. N Engl J Med. 1991;325:445–453.

16. European Carotid Surgery Trialists’ Collaborative Group. MRC European Carotid Surgery Trial: interim results for symptomatic patients with severe (70–99%) or with mild (0–29%) carotid stenosis. Lancet. 1991;337: 1235–1243.

17. Geroulakos G, Sonecha T, Nicolaides A, Fernandes J. The management of patients with asymptomatic carotid stenosis. In: Bernstein E, Callow A,Nicolaides A, Shifrin E, eds. Cerebral Re-vascularisation. London, UK: Med-Orion Publishing Co; 1993:565(b).

18. Langsfeld M, Lusby RJ. The spectrum of carotid artery disease in asymptomatic patients. J Cardiovasc Surg (Torino). 1988;29:687–691.

19. Langsfeld M, Gray-Weale AC, Lusby RJ. The role of plaque morphology and diameter reduction in the development of new symptoms in asymptomatic carotid arteries. J Surg. 1989;9:548–557.