Introduction
- Definition of investigation task
- Task solution and the results of investigation
Conclusion
Bibliography
Modern digital systems of transmission, voice synthesis, verification demand
the work at real time scale. Algorithmic foundation of such systems construction is digital
dynamic frequency analysis [1].
Research work nowelty.. Recurring inverse Fourier transform (RIFT) is
a method of digital dynamic frequency analysis, that let to get the estimation of current
signal spectrum at real time scale. It was developing for the needs of synthetic telephony [2].
However the absence of information on dynamic errors of current signal spectrum estimation
substantively restricts the application of the method in the measuring systems.
Work object is investigation of RIFT characteristics as an instrument
of current amplitude and intermittent process frequency estimation by digital modeling method.
Recurring formula for Fourier coefficients computation, using in the work,
proposed in [2] by R.D. Leitsom and V.N. Sobolev looks like: |
|
|
where Δf=f(N) - f(0)- is a correction factor,
N - is a range,
p – is a symbolic range number
Actual and imaginary parts of Fourier coefficient are defined under the following formula:
: |
Rep+1=Rep+Δfcosω1
Jp+1=Jp+Δfsinω1 |
(1.2) |
|
|
FT effects the computation of the DPF spectrum lines estimation in rotating
reference frame, concerned with the last N counts, arranged in the register memory with
cells volume [3]. Dynamic amplitude spectrum is computed under the formula: |
 |
(1.4) |
|
Computational procedure of the Fourier coefficient is on the figure 1.1.
|
 |
Figure 1.1. - Computational procedure of the Fourier coefficient
|
|
Discrete signal from ADC outlet goes on memory block (MB) entry and on the
first adder entry. Simultaneously is carried out f(0) value pickup from MB, that goes on the
second adder entry and is computed Δf value. The result from adder outlet
goes on summator, where is computed the group of values Δfcosω2, at first quarter of
unit circle.
On permanent memory block (PMB) is kept necessary number of constants,
placed cosω1 and sinω1 values in compliance with cosω2 values [2]. With their
assistance after Δfcosω2 values computation by the commutation are generated
Δfcosω1 and Δfsinω1 These results go
further for Rep+1(n) and Jp+1(n) values computation. On main memory blocks are
kept the values of Rep(n) and Jp(n) computation. After their pickup
from MB1 and MB2 on adders A1 and A2 they are summed up respectively with Δfcosω1
and Δfsinω1 Obtained values are recorded at the cells, from which
were read the Rep(n) and Jp(n) values. They will be used for the computations on
the next step. |
The investigation of RIFT dynamic characteristics was holding with the
assistance of programme, realized on programming language C++ 3.0. Investigated signal –
is a harmonic, with frequency 1Hz, zero initial phase and unit amplitude. The dimension of
running transformation window N=1024 counts. Generation process of current signal spectrum
is on the figure 2.1.
On the figure 2.2. is a current spectrum of harmonic signal during phase jump on 60
degrees on 135th count. The dimension of running transformation window N=128 counts.
By the beginning of phase jump operation the process of signal spectrum assignment is
completed. The process happens under the law similar to linear and completely finishes
for N counts. This moment the value of nonoperating component on (120 – 150) dB less
than basic component level. On 135th count goes the phase jump at 60 degrees, that results
in appearance of new transient process, with completely finishes in 128 counts after its
beginning. Similar process with phase jump at 180 degrees is on the figure 2.3., with the
only difference that reduction of basic component level bears greater character. From this
it could be draw a conclusion that change of basic component level is depend on phase jump
value.
On the figure 2.3. is a signal spectrum during serial injection of two phase jumps at 68
degrees on 135 count and at 122 degrees on 160 county. Assignment of spectrum,
appropriated to physical signal is happened in N counts after the last phase jump. So,
the process of spectrum forming is finished in N counts after agitation beginning, if
it will not be new phase jump.
|
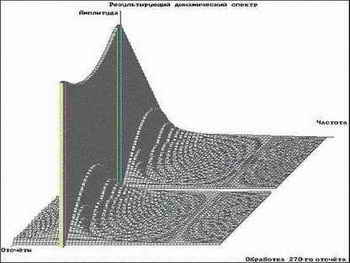 |
Figure 2.2 - Current spectrum of harmonic signal during phase jump on 60 degrees on 135th count. |
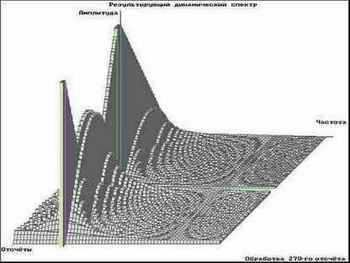 |
Figure 2.3 - Current spectrum of harmonic signal during phase jump on 180 degrees on 135th count.
|
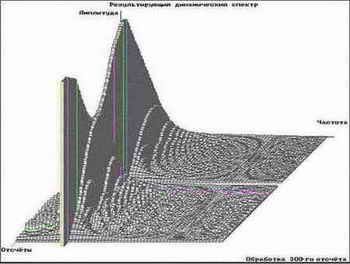 |
Figure 2.4 - Current spectrum of signal during serial injection of two phase jumps at 68 degrees on 135 count and at 122 degrees on 160 county.
|
At all obtained estimations of signal spectrum is a residual component that is a fatal error.
Gradually they collect at the signal spectrum that could leads to the diffusion of physical
process picture.
The problem of RIFT susceptibility to the influence of vibration phase change is displayed,
particularly, during distinction of sampling rate from 2k of signal spectrum maximal frequency
and leads to the residual components appearance at the all frequency band, where works the
analyser. This effect is on the figures 2.5 and 2.6. Thus, in the general case current signal
spectrum contains the error that shoud be estimated.
|
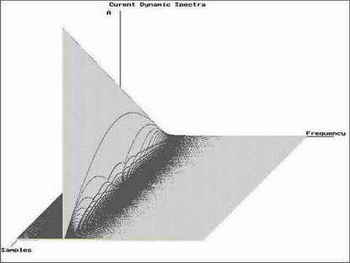 |
Figure 2.5 - Current spectrum of harmonic signal after 1024 counts processing under the sampling rate divisible by 2k (8Hz) |
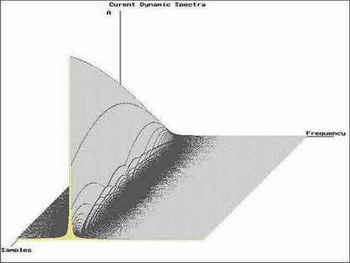 |
Figure 2.6 - Current spectrum of harmonic signal after 1024 counts processing under the sampling rate not divisible by 2k (7Hz)
|
For the estimation of calculation accuracy and determination of information pickup moment it could be applied the criterion of permissible proportion of signal and noise:
|
 |
(2.1) |
|
|
where σi – is a level of i component,
Uk is defined as a sum of the levels of basic component and components, lagged no more than at
± 3 frequency countsfrom basic component. This is conditioned by diffusion effect of basic frequency component in consequence of square scaled window application [4].
It was hold the investigation of γ coefficient dependence on the number
of processed count. Investigated signal – is a harmonic, with frequency 1Hz, zero initial
phase and unit amplitude. The dimension of running transformation window N=1024 counts.
The result of investigation is on the figure 2.7. During the first N counts
γ(n) grows. This corresponds to forming process of signal spectrum. After processing
of N counts the relation is stabilized on the 20 dB level. From here it could be pickup of
information from analyser.
|
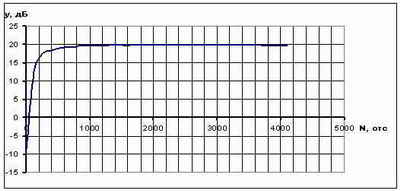 |
Figure 2.7. - Graphic chart of proportion dependence of signal and noise on processing count number. |
Transient process of signal spectrum formation after exposure of elementary agitation finishes
in N counts of time discretization. This moment sharply decreases the level of signal spectrum
transient component. But the end of spectrum computation in terminal member of iterations
could be a cause of spectrum estimations errors accumulation.
The proportion of signal and noise on the analyser outlet reaches the maximum
and stabilizes after the end of N counts processing that appropriates to the end of signal
spectrum forming process. In future the pickup could be made at any moment with similar
proportion of signal and noise. During the information pickup from analyser till the end
of the spectrum formation process it should be mentioned additional error of the computation
of estimated spectrum components levels and background of current spectrum.
At a point in time of report writing the master's thesis is on development
stage. The further investigations will be directed on the receipt of quantitative
characteristics of restoration error of harmonic components frequency of intermittent
chance process and the development of estimation method of energy and frequency data of
signal, invariant to the phase change.
- Plotnikov V.N., Belinskiy A.V., Sukhanov V.A., Zhigulevtsev Y.N. Digital spectrum analyzer - Moscow.: Radio and Svyaz, 1990.– 184p.
- Leites R.D. Sobolev V.N. Digital modelling synthetic telephonic system- Ěoscow: Svyaz, 1969.-120ń.
- Vorontsov A.G. Sinelnikov V.B. Investigation Dynamic Properties of Recurrent Fourier Transform // DonNTU Sceintific works
Series: "Computer engineering and automation" part 107. – p. 56-61.
- Marpl-jr S.L. Digital spectrum analys and its application / Transl. from english - Ěoscow,: Mir, 1990.
|
)
