DEMAND FORECAST BASED MODELLING
AND CONTROL OF SUPPLY CHAIN
ABSTRACT
It is a demanding task to model and control a supply chain if the input information for modelling and control comes from demand forecasts and forecast uncertainty. It requires close co-operation with case companies to get the processes properly modelled and even closer to get them controlled. The aim of the paper is to study supply chain modelling and control based on demand forecasts. It concentrates on modelling and control of the supplier network in an e-logistics environment by using a system theoretical approach. In a modelling section, supply chain modelling is classified into continuous and discrete event models and the characteristics of the most important methods are discussed. The goal of the forecast section of the study is to produce as good point and density forecasts as possible, which are both later used for optimising the supply chain activities. We concentrate on short-term forecast, which can be used for daily and weekly supply chain management. The future aim of the research project is to utilise demand forecasts and their uncertainty for managing and controlling of production and stock levels of a Finnish food company.
Key Words: Modelling, Control, Supply Chain, Demand, Forecasting
1. INTRODUCTION
Studies dealing with supply chain modelling combined with forecasting usually cover the theory of demand forecasting and the demand uncertainty. These studies emphasize the importance of demand forecasts in supply chain management, but mostly do not implement the theory into real supply chain management of industrial companies. Implementation is the challenge: It is difficult to utilise complex mathematical models in business modelling, if the models are created without close co-operation with case companies. In this research project, we are to implement the models created and therefore the business environments of the case companies and their prerequisites for the modelling have been the starting points for the work. One of the most important restrictions for successful modelling is the data that can be gathered from the companies; it is usually quite limited. Fortunately, according to systems theory, complex problems do not necessarily need complex solutions.
The aim of the paper is to study supply chain modelling and control based on demand forecasts. The paper concentrates on modelling and control of the supplier network in an e-logistics environment by using a system theoretical approach. In a modelling section, supply chain modelling is classified into continuous and discrete event models and the characteristics of the most important methods are discussed. The goal of the forecast section of the study is to produce as good point and density forecasts as possible, which are both later used for optimising the supply chain activities. We concentrate on short-term forecast, which can be used for daily and weekly supply chain management.
The structure of the paper is following: We start by going through the work done by others. Then, we describe the project background and research methods. After that, we continue by studying shortly the theory of demand forecasting. Next, we discuss modelling and control of supply chain as well as the most important modelling methods. As a result, we combine demand forecasting with supply chain modelling and control and introduce the first results gained in the research project. Finally, we conclude and have a look at the future work of the research group.
1.1. Related Work
Supply chain is usually modelled using event based modelling, e.g. Chang and Makatsoris (2001) study the requirements for supply chain discrete event simulation modelling. Though, there are studies using different approaches. Petrovic et al. (1999) study supply chain modelling using fuzzy sets whereas Chen and Tzeng (2000) have a fuzzy multi-objective approach to the supply chain model. Carlsson and Fullér (2000) present a fuzzy approach to the bullwhip effect. They consider a series of companies in a supply chain, each of which orders from its immediate upstream member. They show that if the members of the supply chain share information and agree on better fuzzy estimates (as time advances) on future sales for the upcoming period then the bullwhip effect can be significantly reduced.
Li and O'Brien (1999) use dynamic and objective programming for modelling supply chain efficiency whereas Minner (2001) aims at modelling complexity in a supply chain.
Angerhofer and Angelides (2000) give an overview of recent research work on system dynamics modelling in supply chain management. They focus on inventory decision and policy development, time compression, demand amplification, supply chain design and integration and international supply chain management.
Schönsleben (1998) studies the theory of demand forecasts and forecast methods in supply chain management. To implement the theory of demand forecasts, Kaminsky and Swaminathan (2002) study forecast band evolution and capacitated production in the multi-period demand case. They develop heuristics that use demand forecast evolution knowledge to make production decisions in capacitated production planning. They also explore the efficiency of heuristics and the impact of seasonality on demand and availability of information updates.
1.2. Project Background and Research Methods
Modelling and Control of Supply Chain with Systems Theory (2002-2004) is a research project funded by National Technology Agency of Finland and four case-companies. The case companies are from the fields of food industry, pulp and paper industry, IT-trading, information systems engineering and logistics, each having also individual goals. Generally, they are to develop their e-logistics and to improve their current business processes in a strategic level. The aim of the co-operation is to find new ways of operating in an e-logistic environment. Since the research group consists of researchers from project management and logistics, automation and control engineering, and finance and accounting, the project has an interdisciplinary approach and aims at combining the knowhow of aforementioned groups.
Systems research in logistics and operations management has usually both a positivistic and a quantitative research approach (Holweg, 2001). The project for modelling and control of a Finnish food company was started with a study about present situation and future logistics strategies of a case company. The study was a semistructured interview for strategic managers of the case companies. Interviewees were presented a list of open questions involving their current practices and aims for the future. Next, state-of -the-art study about related modelling methods, existing tools and practices for supply chain management was done. It was based mostly on literature but included also a couple of interviews. Modelling was done with Simulink and Matlab.
2. DEMAND FORECASTING
Forecast methods can be divided into history-based and future-based ones. History-based demand forecasts are analytic methods based on consume statistics. They can be further divided into mathematical and graphic methods. Future-based demand forecasts use already existing information about future demand e.g. offers, confirmed orders in a contracting phase and interviews on customer behaviour. (Schönsleben, 1998) In this study, conditional variance models are used for quantifying the demand process uncertainty. The uncertainty can for example be dependent on the level of demand, the previous shocks and the historic level of the variance process.
In practice, difficulties in modelling are often data related. Either there is not enough data or it is of poor quality. Calvin B. Lee (2002) emphasizes the importance of data cleansing in his list of pitfalls in demand chain optimisation. Especially in our case the differentiation between systematic and random changes in the demand process has proven to cause problems in our empirical tests.
The daily demand process exhibits dramatic systematic demand shifts from one period to another, for example due to holidays, sales promotions and so on. These systematic shifts are quite often observed as outliers in the data. In theory, the holidays and similar systematic shifts are possible to model, but they require lots of work. If the forecasts are done on weekly data, then these shifts are somewhat expected to level off.
If less dramatic, but natural everyday demand shifts occur inside one week, the daily process is much more complicated to formulate and estimate compared to the cumulative, that is, the weekly process. For example, consumers who are indifferent in purchasing time point, but are not indifferent in consuming time point can cause such shifts. If these shifts are ignored in the daily process formulation, the systematic shifts will be mixed with actual random process.
It is also possible that the data available for modelling does not include information on situations where the supply is insufficient compared to the current demand. As there is time to adjust to current demand level weekly, the weekly data is expected to converge closer to real demand than the daily data. Due to reasons mentioned above we prefer to model on a weekly basis, even though the weekly data reduces the number of observations. As our task is also to try to improve the daily efficiency in our case companies, we still need to consider the daily data. We do this by updating the weekly forecast with the incoming daily information
3. MODELLING AND CONTROL OF SUPPLY CHAIN
There are several ways to classify supply chain modelling. One is to divide supply chain models into continuous and discrete event models (Figure 3.1). Systems dynamics models and transfer function models are examples of continuous models. Forrester started to study the use of business dynamics for management decision support in the late 1950's. This has lead on to the development of systems dynamics. (Sterman, 2000) Systems dynamics is a theory that studies the structure of feedback systems and influence of the structure on the behaviour of the systems. Also transfer function theory can be used for modelling that is continuous in time and state. (Towill, 1982)

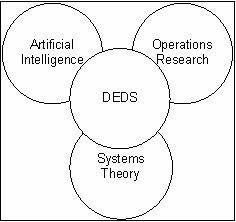
Discrete event based dynamic systems (DEDS) models and agent based models are the most common discrete event models. Systems built by humans (information networks, traffic systems and piece goods production) are usually of discrete nature. The state of these dynamic systems changes as a consequence of events. Natural systems are usually continuous in which case also the change of states is continuous. The need to describe man-made systems better has lead to the development of discrete event-based dynamic systems (DEDS) theory. Due to the heterogeneity of discrete systems, DEDS is not just a single modelling method, but a collection of significantly different modelling methods. As shown in Figure 3.2, DEDS can be considered as a union of artificial intelligence, operation research and systems theory. (Ho, 1989)
The difference between timed and untimed models is distinct. Untimed models take into account only state sequence and omit holding time. Thus, in such models primarily asked questions are qualitative or logical like “yes” or “no” and “true” or “false”. Timed models incorporate time as an integral part of the model and are more suitable for answering performance-related questions like waiting time or total lead-time. Algebraically-based models aim at capturing the description of the trajectories of DEDS in terms of a small set of algebraic operations on functions of state and events. Similarly, continuous variable dynamic systems (CVDS) are described by differential and algebraic operations on function of state and inputs. Performance oriented approaches to DEDS incorporate stochastic effects as an integral part of their modelling. These models are suitable for answering questions such as average waiting time or expected number of damaging events in this period. Queueing theory and Markov chains are the most popular DEDS methods for supply chain modelling (Figure 3.3).

Furthermore, agent-based modelling has found favour with supply chain modellers lately (Swaminathan, 1998). Control, composed of tasks for individual agents, is included in an agent model. It can be impossible to see the target function of the whole model in large agent models.
When we are to develop ways to control a supply chain, we would like to test the system developed. But unlike with a traditional process in systems theory, we cannot do tests with a real chain. Accordingly, we need a model of the system to test it. With the model it is possible to take account of the specific characteristics of the system and to exploit them in control planning.
The popularity of push-pull system in the development in supply chain control has increased lately. The production is usually forecast based until the assembly phase that is controlled in a demand based way. (Ahn and Kaminsky, 2003) The use of forecast methods is emphasized in a push phase of production. In order to define appropriate production and stock levels is it important to quantify the demand uncertainty and to utilize it in production control.
4. RESULTS
Benchmark model was chosen so that it is fairly easy to control by the end user of the forecast. As the factors affecting the demand are transparent and visually presented, it is possible for non-statistician to examine the reliability of the forecast. In practice the demand is often compared to the demand a year before. We assume that the demand process is
Dw,tw =mw,tw Dw,tw −year
where the weekly demand is equal to times demand year before. Now
mw,tw =1+aw,0 +aw,1tw +εw,tw
is a multiplier, which informs us how much the demand deviates from last year’s demand and how it is expected to deviate in the future. To estimate the model we first difference the series and then divide it with last years demand so that we get the relative difference
∆yeardw,tw =aˆw,0 +aˆw,1tw +εw,twdw,tw −year
which is then regressed against a constant and a time trend.
The differencing with one year is essential, because it takes care of the seasonality of the demand process. As it is expected that the differences are also relative to the demand level, the division of the differences is needed. As the relative differences still might be non-stationary we choose to regress the differences against a constant and a time trend, which should then guarantee a stationary residual. Alternatively, the non-stationary series should be differenced once more to reach stationary residuals (Harris, 1995). We try to avoid any unnecessary differencing, because of loss of information and, more importantly, the cumulative effect of outliers in the data.
Our preliminary results show that the price is difficult to be modelled satisfactorily with traditional statistical models. At best we get significant linear relations between price and demand. This is why we try to incorporate expert information into the model and hope to capture even more complex relations, which are known to exist. For example in the case of a product and its substitute the price and demand connection deviates from a simple convex relationship, which can be seen in figure 4.1. Capturing such a complex relation purely from the data requires huge amount of high quality data, which to our experience is highly unlikely to be attained.

In the case of a food production company there is a great number of products so that the forecasts need to be done automatically. This means that at least the benchmark model needs to be stable enough in order to produce a reasonable forecast for all the products and product levels. Also due to the great number of products it is impossible to centralize the analysis of the forecasts, which effects the presentational requirements. As the end user is most likely not equipped with knowledge of statistics we need to offer the forecast in figurative form for a visual examination.
Consequently, aforementioned results bring out new opportunities in supply chain modelling and control. Now, the future problem for the research project is as follows: How much to produce in order to attain the desired service level and to optimise the stock when we know the demand forecast and forecast uncertainty? Accordingly, the desired results are the output for each day and the safety margins for the stock. The factors affecting the production are e.g. the following:
- Demand forecast
- Forecast uncertainty
- Desired service level
- Shelf-life
- Storage time
- Production time
- Stock costs
5. CONCLUSIONS
Systems theory offers simple solutions to complex problems. This is extremely useful in supply chain modelling even though a business environment as a system cannot be tested in the same way as traditional processes. Supply chain as a system is complex, the amount of variables is large and the data that can be gathered is quite limited. Accordingly, the difficulties in modelling are usually data related. Either there is not enough data or it is of poor quality. It is a challenging task to model and control a real supply chain of an industrial company.
It gets even more challenging, if the input information for modelling and control comes from demand forecasts and forecast uncertainty. In this research project, we have chosen the benchmark model so that it is fairly easy to control by the end user of the forecast. As the factors affecting the demand are transparent and visually presented, also a non-statistician can examine the reliability of the forecast. Additionally, price is difficult to be modelled properly with traditional statistical models. Usually we just get significant linear relations between the price and the demand. So, we try to incorporate expert information into the model and hope to capture even more complex existing relations.
The results gained so far bring out new challenges for supply chain modelling and control. There is a need for a research that concentrates on how much we have to produce in order to attain the desired service level and to optimise the stock when we know the demand forecast and forecast uncertainty. Accordingly, the desired results can be used as the output for each day and the safety margins for the stock.