Modeling and forecasting the demand for sawnwood in western Europe from an end-use perspective
ABSTRACT
The traditional analysis of sawnwood demand is based on the aggregate relationship between sawnwood consumption and GDP. Sawnwood is, however, used in a variety of sectors with different consumption patterns. To account for the specific characteristics of end-uses sector models are applied. Sector classification is undertaken, a data base is constructed, and econometric models are specified for the activities in these sectors and, in some applications, for the market share of sawnwood in the sector to account for substitution. This approach has been used in analysing and forecasting the demand for sawnwood in Sweden, Norway, United Kingdom and Germany. In some of the applications, Seemingly Unrelated Regressions (SUR) and Vector AutoRegression (VAR) models are used.
Keywords: Econometric models, end-use analysis, sawnwood demand, sector models, Seemingly Unrelated Regressions, substitution, Vector Autoregression.
INTRODUCTION
The demand for sawnwood is generally analysed on an aggregated level, where the most important explanatory variables in econometric models are GDP (FAO, 1985), construction (Martin et al, 1988) or an end-use indicator (FAO/ECE, 1986). Sawnwood is, however, used in a number of sectors and its consumption pattern differs substantially among sectors. One important determinant of sawnwood demand is substitution, which is difficult, if it all possible, to analyse on an aggregate level since the underlying consumption patterns vary considerably between sectors. The conclusion is that end-use (or sector) analysis is essential for understanding the behaviour of sawnwood demand; specifically because substitution requires disaggregated analysis and each sector has its own consumption pattern that should be accounted for in the analyses.
OBJECTIVES
The objective of this paper is to presnt the methodology of constructing the data base, sector modelling and forecasting sawnwood consumption in a given country from the standpoint of (end-use) sector classification. More precisely, the objective is
· to specify homogenous sectors with respect to sawnwood consumption
· to produce a time series data base for sawnwood consumption by sector for analysis and forecasting
· to specify a set of models that explain consumer behavior in the sectors that are based on sound theoretical formulation and practical consideration
· to use the estimated model system to produce forecasts.
The objective of this paper is to give an overview of the research in this field, an outline of modelling approaches and to present some aggregate results with examples of details.
DATA
No time series data base exists for any country regarding quantities of sawnwood consumption by sector. Cross sectional studies may exist for some years that provide us with quantitative information about sawnwood used in various sectors. Here, a methodology has been developed based on previous studies (e g Cardellichio & Veltkamp, 1981) to construct a consistent time series data base for end-uses of sawnwood. Existing cross sectional end-use studies constitute one piece of information necessary for construction of approximate historical data. The other source is time series data from available construction and industry statistics for the country studied. By combining these different data sets an annual data base is set up that covers the period from, say, 1980 to the present day. One complication, however, is that for a given country, sector classifications in cross-sectional studies are often inconsistent over time.
The classification of end-use sectors depends on the availability of data and the objective of analysing homogenous sectors with respect to sawnwood demand. The sector classification in Table 1 is appropriate for the United Kingdom.
Table 1. Sector classification for the United Kingdom.
Construction
New dwellings
Private
Traditional
Timber framed
Non private; 'Public' and 'Housing Associations'
Traditional
Timber framed
Non-domestic constructions
Education
Health
Industries
Commercial
Other non-domestic constructions
Other construction
Civil engineering
Scaffolding
Portables
Agricultural/horticultural (which are not dwellings)
Mining and quarrying
Repair, Maintenance and Improvement (RMI)
Joinery
Windows
Doors
Floors
Stairs and ladders
Fencing
Furniture
Packaging incl pallets
Do-It-Yourself (DIY)
Other uses
Here, joinery is not included in construction to avoid double-counting. Joinery is partly used in RMI, but is here included under joinery. 'Other uses' include mouldings, glue-laminated wood, coffins, specially treated wood, instruments etc. The sector classification varies among countries because of different consumption patterns and differences in available data.
The data used in the construction of the database are essentially based on building, construction, other industrial statistics (production, imports and exports) and national accounts data. Price and cost data are obtained from Central Statistical agencies as well as from sector organizations.
Key numbers are essential for constructing the time series of sawnwood used in the sectors. For new housing, time series of the number of housing starts exist in official publications. Cross sectional studies may give the amount of sawnwood used per dwelling. Multiplication of the key number by the number of housing starts give approximate quantities of sawnwood used for new housing. Similar calculations are undertaken for other sectors where the key numbers may be the amount of wood used per invested GBP, for instance. All information of variation over time for key numbers exist, it is used in constructing the time series database.
The estimated consumption of soft sawnwood in Sweden is given in Figure 1 for the period 1985 to 2002 with the corresponding classification in Sweden. Here the total is the officially reported level of sawnwood consumption.

A pilot study was carried out for Norway (Baudin & Solberg, 1986, 1987 and 1989) with only five end-use sectors analysed. In the Swedish study (Baudin, 1989A, 1989B and 1990, Lönner 1991) 14 sectors were analysed and forecast, and in the UK study (Baudin, 1992, 1993) 19 sectors were analysed and forecast. In a study for Germany, 21 sectors were investigated (Flinkman, 1993, 1994). An update for Sweden was done by Dackling (2001).
The time series obtained are short both for modeling and proper long term forecasting purposes. This, however, is the only data set available at this detailed level.
The second step of the forecasting procedure involves the specification and estimation of econometric demand models. The third step entails forecasting of demand by using input forecasts on exogenous variables (GDP; private consumption, interest rates, inflation ect) from national sources, such as NEDO in the UK, the IFO-institute in Germany and the Swedish Government's Long-Term Studies.
MODEL FORMULATION
The demand for sawnwood and its substitutes is basically a function of the variation and level of activity in the different economic sectors which use forest products. It is also a function of the intensity of their utilization for different end uses. The level of consumption of sawnwood is therefore affected both by changes in the level of actvity of the end use sectors and by changes in the patterns of use (substitution).
Models of this type are intended to cover two alternative aspects of sector demand: demand for wood products in the sector in terms of units produced, production value etc. or demand for the sector's output, where wood is one of many competing products.
Priority is given to primary data in the analysis; estimated quantities of sawnwood used in sectors are not included in the econometric models. In forecasting sawnwood consumption for dwellings, for instance, the number of dwellings produced is the target variable. Only at the final step of the forecasting procedure are key numbers such as the assumed average use of sawnwood per dwelling etc. used to make final calculations of quantities of sawnwood used in the sectors.
The econometric models can be classified as combined factor/consumer demand models, derived from the following considerations.
(i) Total production in sector m can be represented by a twice differentiable production function
![]() (1)
(1)
where ![]() is the production output from sector m during time
period t
is the production output from sector m during time
period t
![]() is the input of sawnwood in sector m during time
period t
is the input of sawnwood in sector m during time
period t
![]() is a vector of other production inputs in sector m
during time period t
is a vector of other production inputs in sector m
during time period t
![]() is a time index representing technological change;
is a time index representing technological change; ![]()
Minimizing costs subject to (1) and with prices given, Shepard's lemma implies that producers' demand for sawnwood in sector m during time period t will be
![]() (2)
(2)
where ![]() denotes the unit price of sawnwood during time period
t;
denotes the unit price of sawnwood during time period
t; ![]() are unit prices of other inputs in sector m; and
are unit prices of other inputs in sector m; and ![]() are unit prices of all other goods during
time period t.
are unit prices of all other goods during
time period t.
Now, ![]() is determined by consumer demand. If the utility
function is maximized for individual i subject to income constraint
is determined by consumer demand. If the utility
function is maximized for individual i subject to income constraint ![]() we obtain
we obtain
![]() (3)
(3)
where ![]() is the ith individual's demand for product m during
time period t.
is the ith individual's demand for product m during
time period t.
On the assumption that identical and homotetic utility functions exist (i e income changes do not alter proportions) an aggregation across individuals gives
![]() (4)
(4)
where ![]() is the average per capita income during time period
t.
is the average per capita income during time period
t.
According to information theory, it is reasonable to
assume that time is needed for consumers (whether they are 'individuals' or
'organizations') to react to changes in income or prices. Thus time ![]() is included in the model as an explanatory
variable, giving
is included in the model as an explanatory
variable, giving
![]() (5)
(5)
Alternatively, and using the same argument, lagged variables can be included in the model. The dependent variable can be lagged as can independent variables.
Now, combining (2) and (4), we obtain
![]() (6)
(6)
The data quality does not permit ![]() to be used directly in the analysis, since
only estimated quantities of sawnwood are available. Instead, primary data are
used: the number of dwellings, the number of windows, the value of wooden
packaging etc. When primary data are available, key numbers are applied to
them, e g the sawnwood content per dwelling, per window, per GBP of sales of
wooden packaging, to give us sawnwood consumption forecasts.
to be used directly in the analysis, since
only estimated quantities of sawnwood are available. Instead, primary data are
used: the number of dwellings, the number of windows, the value of wooden
packaging etc. When primary data are available, key numbers are applied to
them, e g the sawnwood content per dwelling, per window, per GBP of sales of
wooden packaging, to give us sawnwood consumption forecasts.
The estimated sector models are log-linear, where coefficients are directly interpreted as elasticities.
A log-linear model for a given sector is specified as
![]() (7)
(7)
where ![]() denotes the natural logarithm for the dependent
(endogenous) variable time period t
denotes the natural logarithm for the dependent
(endogenous) variable time period t ![]() are logarithms of independent (exogenous) variables
in (6) time period t
are logarithms of independent (exogenous) variables
in (6) time period t
![]() are coefficients to be estimated and
are coefficients to be estimated and
![]() is a random error with zero expectation and constant
variance.
is a random error with zero expectation and constant
variance.
Lagged endogenous and exogenous variables can also be included in (7).
If residual analysis reveals that the model is not in equilibrium, differencing is used to achieve stationarity (Banerjee et al. 1993). For the United Kingdom, equation (7) is estimated for 11 sectors (Table 2).
Table 2. Sectors analysed by applying econometric models in the United Kingdom.
Dwellings Other Building & Construction Windows Flooring
Furniture Non-domestic constructions RMI Doors
Stairs Fencing Packaging
The sector models seem to be unrelated, but there are common underlying structures, e g construction, the general trend and the business cycle. Consequently, Seemingly Unrelated Regression (SUR) procedures are applied (Zellner, 1962) since the overall precision of the models is expected to be improved if SUR-estimation is applied.
In the Swedish study, substitution analyses are carried out and particular issues of investigation considered in the Swedish analyses (Baudin, 1990) are the reasons for substitution:
(i) Is the substitution between different materials based on price competition ?
(ii) Is it a cost based substitution ?
(iii) Is substitution balanced by income factors ?
(iv) Does substitution depend on other factors such as fashion, legislation,
technology which are not included in cost or price variables ?
Substitution is considered from the viewpoint of
competition between sawnwood and alternative materials such as metals,
fibreboard, particleboard, plastic materials, etc. The market share of sawnwood
is defined as value share, volume share or surface share depending on the
character of data available. For sectors where data on substitutes for sawnwood
are available, the market share for sawnwood, denoted ![]() in sector
in sector ![]() , is analysed to find the causes of substitution.
, is analysed to find the causes of substitution.
The most important explanatory factors of the
behaviour of the market share ![]() are expected to be the real price of sawnwood (
are expected to be the real price of sawnwood (![]() ) and a vector of prices of substitutes (
) and a vector of prices of substitutes (![]() ). Other important explanatory factors are
real private consumption (
). Other important explanatory factors are
real private consumption (![]() ) and unit labour costs (
) and unit labour costs (![]() ). The reason for including private consumption is
that, with varying income, household preferences may change to other
materials. Unit labour costs,
). The reason for including private consumption is
that, with varying income, household preferences may change to other
materials. Unit labour costs, ![]() , are included to take application costs into
consideration: Materials associated with lower application costs may be
favoured at the expense of materials with higher application costs.
Furthermore, a time trend variable (
, are included to take application costs into
consideration: Materials associated with lower application costs may be
favoured at the expense of materials with higher application costs.
Furthermore, a time trend variable (![]() ) is introduced to represent other factors such as
technology, fashion and legislation. Time lags of dependent and independent
variables are introduced to 'explain' the inertia of the model system.
) is introduced to represent other factors such as
technology, fashion and legislation. Time lags of dependent and independent
variables are introduced to 'explain' the inertia of the model system.
The market share model is then:
![]() (8)
(8)
Here, ![]() is a random error with zero expectation and constant
variance. Since the market share,
is a random error with zero expectation and constant
variance. Since the market share, ![]() , lies in the range (0,1) the functional specification
of (8) should be chosen to meet this requirement. One such specification is the
logistic function, which is s-shaped ranging from 0 to 1.
, lies in the range (0,1) the functional specification
of (8) should be chosen to meet this requirement. One such specification is the
logistic function, which is s-shaped ranging from 0 to 1.
Defining ![]() as the vector of independent variables,
as the vector of independent variables, ![]() , the specification of (8) is
, the specification of (8) is
![]() (9)
(9)
This nonlinear expression can be transformed to a linear function, a logit model:
![]() (10)
(10)
Here, ![]() is the logit transform
is the logit transform ![]() . In some model specifications the lagged
dependent variable
. In some model specifications the lagged
dependent variable ![]() is included as an explanatory variable in (10) as are lagged
independent variables.
is included as an explanatory variable in (10) as are lagged
independent variables.
With respect to the limited number of observations available and the obvious risk of multicollinearity, all variables in (7) and (10) cannot be estimated simultaneously. Therefore, a step by step procedure is applied where subsets of variables are tested and at the final stage a combination of important variables from the subsets has been retained. The procedures are manual and the choice of model is governed more by economic considerations than by significance criteria.
Substitution analysis is not carried out for the United Kingdom and Germany. Preliminary analyses for these countries revealed that the market share for sawnwood is rather constant over the observation period and, furthermore, since data for wooden materials (wooden doors, wooden windows etc.) exist, substitution analysis is not necessary. This means that, for these countries, model (7) is applied directly to the sectors, and that, e g, the number of wooden windows, value of sales of wood furniture etc. are analysed based on the log-linear approach.
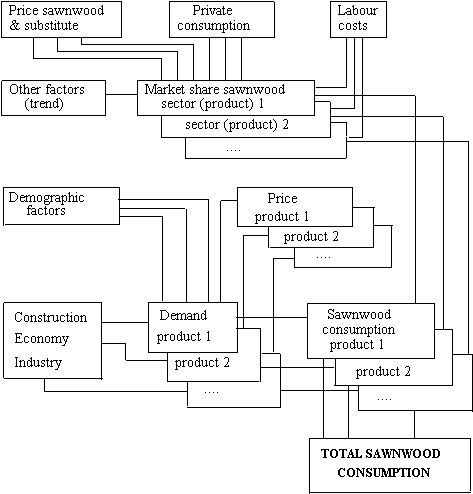
For Sweden, the model outline is presented in Figure 2 where the upper part includes the substitution (logit) models and the lower part the sector models.
Figure 2. A model of the demand for sawnwood in Sweden.
MODEL ESTIMATION
Examples of models are shown here rather than complete sets. From the set of 11 equations estimated by SUR for the United Kingdom, the equations for dwellings and windows are shown in Tables 3 and 4.
Table 3. Estimated model for housing starts in the United Kingdom.
Dependent variable: lnHS, the natural logarithm of housing starts R2adj = .68
Time period analysed: 1970 - 90 (annual data) se = .15
DW = 1.45
|
Variable |
Elasticity |
t-value |
|
lnR |
-.3505 |
-3.09 |
|
lnI |
.6822 |
2.88 |
|
t |
-.0474 |
-7.54 |
Independent variables:
lnR, the natural logarithm of the (nominal) interest rate
lnI, the natural logarithm of real gross fixed capital formation
t, a time index; t=1 for 1970, t=2 for 1971 etc.
Different specifications have been tested, including the price index of new housing, the real interest rate, inflation, private consumption etc. The nominal interest rate is included in the model since it can be expected to reflect the buyers' long-term cost expectations. Gross fixed capital formation is included since it can be expected that the incentives for the consumers investments in new housing are the same as the reasons for their investments in industry and the public sector. The trend is negative, indicating a decline in new housing when all other factors are kept constant. This can be an effect of long-term demographic factors such as the decline in the number of households and/or the decreasing share of young people in society.
Table 4. The estimated model for the demand for wooden windows in the United Kingdom.
Dependent variable: lnWIN, the natural R2adj = .83
logarithm of the number of wooden windows se = .06
produced in the UK DW = 1.88
|
Variable |
Elasticity |
t-value |
|
lnHS |
.4571 |
8.47 |
|
lnRMI |
.8723 |
9.98 |
|
DUM73 |
.3022 |
9.26 |
Independent variables:
lnHS, the natural logarithm of housing starts,
ln RMI, the log of real investment in repair, maintenance and improvement of construction
DUM73, a dummy variable, unity for 1973 and zero elsewhere.
Among the explanatory variables in this model are variables that are endogenous in other models (cf. the model for housing starts in Table 3). Here, the obvious reason is that windows are included in new buildings and repair and maintenance (RMI). The coefficients are positive: increased building activity implies increased demand for wooden windows. The elasticities are, however, less than one which can be an indication of substitution. A dummy variable is included for the extreme year 1973.
Model (10) is applied for substitution analyses. In the estimation, special attention is paid to the multicollinearity problem. Here, only one example will be shown: the market share model of packaging in Sweden (Table 5).
Table 5. A model of the market share of wood in packaging in Sweden.
Dependent variable: Logit of the (value) market share for wood in packaging
Time period analysed: 1970 - 1986 (annual data). R2adj = .83 se = .09
DW = 1.74
|
|
|
|
|
Variable |
Coefficient |
t-value |
|
Intercept |
-2.6254 |
|
|
t |
-.032325 |
-7.1 |
|
pt |
-.004616 |
-2.6 |
|
p1t-1 |
-.013136 |
-2.6 |
|
p2t-1 |
.021952 |
2.3 |
Here, pt denotes the real unit price of sawnwood; p1t is the real producer price index of paper and paperboard; and p2t is the real price index of chemical products (an indicator for the price of plastic films).
The price coefficient of sawnwood is negative, which is expected from theory, while the coefficient of prices of chemical products is positive, indicating substitution between the products. The coefficient of paper and paperboard is negative which indicates that the two materials do not compete in the same segment. The trend factor is negative which means that, with all other factors constant, sawnwood will lose market share.
To obtain a figure for the level of sawnwood consumption for packaging, the market share model is supplemented by a model of the demand for packaging. The results for Sweden are shown in Table 6.
Table 6. A model for the total consumption of packaging in Sweden.
Dependent variable: The natural logarithm of the total sales of packaging in Sweden (million SEK).
Time period: 1970 - 86. R2adj = .76 se = .04
DW = 2.20
|
Variable |
Elasticity |
t-value |
|
lnMXt |
.754514 |
2.6 |
|
t |
.043431 |
5.6 |
|
lnCt |
1.374601 |
6.4 |
|
|
|
|
The index of industrial production in the manufacturing industry (MX) is an important explanatory variable, as expected. The trend factor is also important - this is positive indicating overall growth in the packaging industry. More surprising is the cost factor which has a positive sign. This could be an expression of indirect factors indicating that increased consumption of packaging materials follows from higher wages. The model fit is shown in Figure 6.
FORECASTING
To obtain forecasts of the endogenous variables of the model system the exogenous variables of the system must be forecast. The forecasting procedure is based on the following conditions:
(i) Official macroeconomic forecasts of GDP, Private consumption, Gross fixed
capital formation etc. are used as exogenous inputs to the estimated model
system
(ii) For those variables where official forecasts are not available, ARIMA-modelling
(Box & Jenkins, 1976) is used to establish projections. This is the case for variables
such as price levels, inflation, interest rates etc. Low and high forecasts are compared to
average projections, where the low/high values are given by 75% confidence
limits of the ARIMA - projections. Alternatively, multivariate methods such as
Vector ARIMA (VARIMA) or Vector Autoregression (VAR, e g Lütkepohl,
1993) are applied.
(iii) For the UK and Germany, the econometric system is estimated using SUR.
Forecasts of exogenous variables are, for Germany, obtained by VAR models
(Flinkman 1994).
The observations to 1988 and forecasts to year 2000 of the end-uses and total sawnwood consumption in Sweden for the main alternative forecast are presented in Table 7. We can now compare with the outcome that indicates an underestimation of the total consumption.
Table 7. The consumption of sawnwood in Sweden classified by end-use. Observations are up to
and including 1988 and forecast are up to and including year 2000. Main forecast
alternative. Note: Joinery includes windows, doors, flooring, moulding and interior fittings (thousand cubic meters). RMI is Repair, Maintenance and Improvement.
|
Year Cons- Joinery Furni- Pack- Trea- RMI Other Total truction ture aging ted wood uses 1970 1773 435 289 1351 294 81 716 4938 1975 1853 484 331 947 455 111 863 5045 1980 1298 453 240 983 461 140 1121 4696 1985 795 409 214 900 490 290 455 3553 1988 1148 516 230 1086 550 270 900 4700 1990 923 559 232 958 575 296 691 4234 1995 772 497 215 935 722 322 644 4107 2000 721 463 203 813 854 357 590 4001 |
In the FAO-forecast of 1985, the consumption level in the year 2000 was expected to be around 5.6 million cubic metres. This can be compared to the forecasts of FAO/ECE, the high and low alternatives of which are 5.0 million and 4.5 million cubic meters, respectively. The FAO/ECE came close to the outcome. It should, however be mentioned that the time series of sawnwood consumption was revised at the end of the decade and a measurement error of approximately one million cubic meters was discovered.
The main advantage of the end-use approach is that substitution is accounted for and consequently the forecasts are less optimistic, and so far more realistic, than in the aggregate approaches.
Alternative forecasts of the demand for sawnwood in the sectors can be derived with the objective of demonstrating forecast uncertainty. By adding the low and high alternatives, respectively, an aggregate picture of the inherent uncertainty of the forecasts can be established.
DISCUSSION
This paper presents an overview of methods used for obtaining a deeper understanding of the inherent patterns of use of sawnwood in some countries in West Europe. In situations where end-use data are not available, which is most frequently the case, the methods used here may serve as guidelines for similar studies in other countries having the same purpose. Furthermore, the methods used reveal that it is possible to specify and estimate sector demand models. It is then possible not only to study total demand in a sector but also to find reasons for substitution. Generally it has been found that macro-economic factors such as GDP play a less dominant role in end-use analysis than in aggregate analyses. Instead, factors such as investment, interest rates, industrial production and prices of final products are important determinants of sector growth in sector models. Substitution, in positive or negative directions, occurs as a consequence of price changes for sawnwood relative to competing products. One consequence is that the forecasts obtained from end-use analysis differ substantially from those obtained from more aggregate analyses. In general, the end-use (disaggregate) analyses give lower projections than those obtained from aggregate analyses.