The Blast Furnace (BF) is the most dominant process of ironmaking worldwide. Coke is the most important and expensive raw material in the BF and has a strong influence on the process efficiency and hot metal quality. Due to increasing environmental concerns and recent shortage of coke, there is an increasing trend to replace coke by other fuels such as injecting pulverized coal through tuyeres in order to decrease reliance on coke. Coke performs several functions in a blast furnace namely thermal, chemical and mechanical: a fuel providing the energy required for endothermic chemical reactions and for melting of iron and slag; a reductant by providing gases for iron oxide reduction; a permeable grid providing the passage for liquids and gases in the furnace. At low coke rate BF operation, less amount of coke is available in the burden to maintain sufficient permeability of bed. As the coke moves towards lower zones of a blast furnace, it degrades and generates fines, which affects the bed permeability and the process efficiency. Therefore, superior coke quality is critical for a stable and efficient blast furnace operation under low coke rate conditions.
The intensity of coke degradation in a blast furnace is strongly influenced by coke properties and associated phenomena such as solution loss reaction, thermal stress, mechanical stress and alkali accumulation. A range of laboratory tests and procedure have been developed to characterize the coke quality in order to assess their degradation potential in a blast furnace. The cold/hot strength of coke is often estimated by laboratory tests conducted under a specified set of reaction conditions. The CRI (Coke Reactivity Index) and the CSR (Coke Strength after Reaction) developed by Nippon Steel Corporation (NSC), Japan is one of the most popular such test, which is the most widely recognized or seriously considered test around the world.1,2) High CSR value of coke is believed to prevent coke from breaking down, improve the permeability of gas and liquid and increase the productivity as well as decrease the specific coke consumption.3) Many empirical correlations based on ash chemistry and the CSR tests have been developed in order to predict coke degradation behaviour in an operating blast furnace. Often individual steelworks relies on their own empirical experience for the interpretation of CSR measurements and some times modify the coke reactivity test conditions in accordance to their individual blast furnace operations.
Despite widespread popularity, there are well known concerns about the reproducibility of CSR measurements as well as the validity of the predicted coke behaviour.4) Alternatively, a detailed comprehensive understanding of coke behaviour can be made by testing coke behavior in an experimental blast furnace. Even though the EBF tests are time consuming, tedious and highly expensive, the information generated is of great value in terms of their reliability suitability due to simulation of more realistic conditions of a blast furnace process.
Coke degradation in a blast furnace occurs due to chemical, mechanical and thermal effects. At higher flame temperature, cracking of coke is mainly attributed to thermal stress while at lower temperatures, the degradation behaviour is influenced by coke reactivity which is dependent on other coke properties. The coke reactivity can be influenced by its three major properties namely porosity, carbon structure and constituent minerals. Coke pore structure is modified by growth and/or coalescence of pores, which is often related to fluidity and swelling characteristics of parent coals,5) and modifies the available carbon surface area for gas reactions. Coke displays graphitisation behaviour particularly at temperatures exceeding 1200°C, which is influenced by the catalytic effect of minerals such as iron, and is believed to weaken the abrasion resistance.6) Iron in coke is also believed to catalyze gasification reactions 7) which could have different implications on coke behavior in the EBF. The influence of other minerals particularly those containing alkali on the coke degradation is less certain. The main aim of this study is to investigate the effect of alkalis on coke behaviour in the experimental blast furnace. Therefore, it is imperative to discuss further various aspects of alkalis influence on coke behaviour.
In an operating blast furnace in a temperature range of 800-850°C,6) alkali carbonate deposition is limited to coke surface without affecting its size or strength or causing any additional stress in the bulk coke. Alkalis are known to influence the solution loss reaction by initiating gasification reaction at considerably lower temperatures (750-850°C) compared to classical gasification temperatures of 950°C, and also increase the reaction rates as a function of potassium content.8,9) The catalytic effect of alkalis and iron phases on coke gasification was also reported in other studies.10) Potassium content of coke varies at different locations in a blast furnace e.g. alkalis are completely vaporised at raceway and their concentration becomes low in hearth coke while alkali concentration is significantly high in the dead-man coke such that potassium content reaches up to 30% of total coke ash.8,11,12) Potassium is generally believed to weaken the coke strength at high temperatures.8) Concentration gradient of alkali in coke lump was reported to be responsible for stress abrasion of alkali-rich layer of coke.14) In other study, up to 5% variation of alkalis in coke did not indicate any adverse impact on the coke strength (CSR).15)
Potassium adsorption by carbonaceous materials such as coke could vary in many ways depending on the nature of the carbon phase as well as the treatment temperature.13) Non-graphitic carbons such as coke are believed to exhibit increased degree of potassium absorption with increasing temperature up to 1000°C, and was related to modification of macro pore size and surface area due to activation.13) Potassium species can interact with coke by two mechanisms namely by diffusing/adsorbing in the carbon microp-ores or by intercalating with carbon.13) Potassium adsorption in coke can cause irregular swelling, increased stress, modification of surface area, microstrength, and possibly size degradation13) without affecting the crystallite height of coke carbon signficantly.13)
Despite several studies indicating possible relationship between alkali content and coke strength, there are uncertainties regarding their extent of impact and their role on the mechanisms of coke weakening.6) The influence of alkalis on coke gasification in a blast furnace also raises the concerns about the suitability and interpretation of the conventional CSR test results12) due to its inability to account for the effect of recirculating alkalis. Therefore, there is a need to understand the influence of alkalis on modifications of coke properties and its association with coke strength in an operating blast furnace. For this purpose a high CSR coke was tested in an Experimental Blast Furnace (EBF) at Lulea, Sweden. The main aim of this study is to study the effect of alkalis on the modification of physico-chemical properties of coke during its descent in an experimental blast furnace and their association with coke strength as well as abrasion. Measurements of carbon structure, porosity and alkali distribution of the centreline EBF coke samples are presented. Evolution of coke strength and abrasion resistance of coke in the EBF was related to their carbon structure and alkalis concentration.
2. Experimental
2.1. Experimental Blast Furnace Campaign
The current study is based on the coke samples from a dissection study of tenth campaign conducted in 2002 in the Experimental Blast Furnace (EBF) situated in Lulea, Sweden. The fuel and coke rates were of the order of 500kg/thm and 350kg/thm respectively while blast temperature was around 1200°C. The EBF has a working volume of 8.2m3 and a diameter of 1.2m at the tuyere and is 6m high from the stock line to the tuyeres.16-18) The campaign was conducted to test a range of blast furnace materials including the performance of a high CSR coke. This coke was specially prepared at SSAB Lulea coking plant by blending of 67% low to medium volatile Australian coals, high volatile US coals and a small percentage of pet coke. After completion of the campaign in 8 weeks, the EBF was quenched by purging nitrogen continuously for 10 d from the top. Top quenching also restricted the upward movement of heat flux and retarded any subsequent reactions of the burden constituents.16-18) The reacting gases were removed from the tuyeres in short interval of less than a minute so that subsequent reactions ceased. Approximately 20-35 coke pieces were collected from several vertical and radial locations of the EBF after quenching.
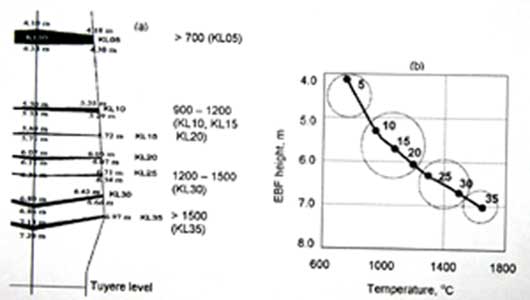
All coke layers were sampled at three radial positions namely centre line (C), middle (M) and close to wall (R). The selection of layers was based on previously conducted laser measurements. Only centre line cokes were selected for this study. Physical locations and codes of the EBF cokes are illustrated in Fig. 1(a). Coke samples from various locations represent different zones of the EBF. For example, sample KL10C indicates a center line coke sample at 10th layer. Figure 1(b) illustrates the temperature of coke layers based on separate thermal probe measurements. Based on thermal profile coke KL05C represents the stockline coke; Samples KL10C, KL15C and KL20C represent the thermal reserve zone coke while samples KL25C and KL30C represent the cohesive zone cokes. Based on physical conditions of layers during excavation, sample KL35C is used to represent the extreme lower end of the cohesive zone. Chemical composition of the feed coke is provided in Table 1, while CSR (68.8) and CRI (23.15) values of the feed coke are shown in Table 2.
2.2. XRD of Cokes
Carbon structure of coke is often related to the reactivity as well as graphitization,7,19) and can be measured by the X-ray diffraction. Graphitization degree of the EBF coke was measured in terms of the crystallite height of coke carbon (Lc). Siemens 5000 X-ray diffractometer at the University of New South Wales (UNSW), Australia was used to obtain the XRD patterns of cokes. Two small coke lumps (approximately 6-8 cm3) were selected from each layer and crushed to powder (<75 micron). The XRD patterns were obtained by recording the scattering intensities of coke powder by using Copper Ka radiation (30kV, 30mA) as the X-ray source. Coke powder was packed into an aluminium holder and scanned over an angular range from 5-105° using a step size of 0.05° and collecting the scattering intensity for 5 s at each step. The carbon crystallite height (Lc) of EBF cokes was evaluated by analysing the 002 carbon peak of the XRD pattern20) following classical Scherrer's equation.21)
Lc = 0.89 * λ / (B * cos θ)
where λ is the wavelength of the X-ray radiation, B is the full width at half maximum intensity (FWHM) of the 002 carbon peak and θ is the 002 carbon peak position. A sharper 002 peak represents a larger carbon crystallite and a greater degree of ordering of the carbon structure of coke or graphitisation.19) The carbon content of EBF cokes was also measured by using carbon analyser (LECO) at the University of New South Wales.
2.3. TGA Reactivity of Cokes with CO2
Non-isothermal reactivity was measured by using ~70mg of coke powder in an Al2O3 crucible with the help of Netzsch STA 409 Thermal Gravimetric and Differential Thermal Analyser (TGA/DTA) located at Lulea University of Technology. Figure 2 shows the schematic of the TGA/DTA. All the EBF cokes were reacted under dynamic heating up to 1300 °C with a heating rate of 10 °C/min and a CO2 flow rate of 100 mL/min. A custom built TGA situated at the University of New South Wales, Australia was used measure isothermal reactivity of cokes. The TGA furnace was made of recrystallised vertical alumina (60mm ID) tube in which the sample temperature was controlled by an internal thermocouple located close to the sample holder. Approximately 0.2 g coke powder was placed on a square alumina crucible (30X30 mm) holder at room temperature, and the assembly was suspended with a high temperature stainless wire to a balance to measure the weight loss with an accuracy of the order of 1 μg (Precisa® 1212 M SCS). The assembly was kept at a low temperature zone in the furnace followed by heating up to 900 °C at the rate of 2 °C/min while 5 L/min of N2 was continuously purged through Brooks 5850 E mass flow controller. As the furnace reached 900 °C, the reaction chamber was raised into hot zone followed switching of gases to 4 L/min of N2 and 1 L/min of CO2. The weight loss of coke was continuously recorded to data logger to calculate the carbon conversion.
2.4 SEM / EDS Analysis
Two sets of coke samples were examined by using Scanning Electron Microscope (Philips XL 30) equipped with Energy Dispersive X-ray Analysis (EDS). Coke pieces were mounted in an epoxy slow-setting resin in plastic moulds (40 mm diameter). Surfaces were successfully ground on four different grades of silicon carbide paper (120, 500, 800, and 1200 grit) with distilled water (without any impurity) and polished with three different grades of paper with diamond paste of particle sizes of 15 μm, 9 μm, 3 μm, and 1 μm and lubrication fluid. The polished coke samples were mounted on aluminium support and coated with a thin layer of gold-palladium alloy using a Bal-tec MCS 010 sputter coater. In each coke sample, the elemental composition of mineral phases at several spots was also analysed with EDS analysis with particular focus on the variation of potassium in the aluminosilicate phase and carbon matrix.
2.5. Light Optical Microscope (LOM) and BET N2 Adsorption
The coke porosity was measured by using Light Optical Microscope (Olympus BH-2-UMA) equipped with motorized microscope stage (Marzhauser). Previously prepared polished coke stubs used for SEM analysis, were also used for the optical analysis. The stubs were mounted in a special holder for microscopic examination. The images of coke surface were acquired at two magnifications of 130x and 520x in order to improve the reliability of data, and were processed by using a computer software (Leco 3001) to obtain the macro and micro pores data. The BET surface area of EBF cokes was measured by using a FlowSorb 2300 by adsorbing N2 at 77 K.
2.6. Coke Strength (CSR) and Abrasion (I-drum Test)
The CSR value of the feed cokes was measured after standard CRI test. The CSR and CRI values of feed coke are provided in Table 2. The variation of coke strength in the EBF was estimated by conducting the I-drum test on the quenched EBF coke. In order to distinguish the I-drum test values of the EBF coke from the standard "CSR" test measurements, a new strength index namely Coke Fine Index (CFI) was defined. On this basis, CFI values will represent the percentage of coke retained on 10 mm sieve after tumbling for 600 revolutions for 30 min. The CFI values of the EBF reacted coke samples were obtained by directly tumbling the cokes without further reacting with CO2 in order to assess the effect of EBF reaction environment, temperatures and alkali exposure. The CFI values of the EBF cokes were much higher (~80 s) than the CSR value of feed coke (65) due to omission of the CRI step.
The percentage of coke passed through a 0.5 mm sieve after conducting I-tumbling test directly on the EBF cokes was used to represent abrasion index. It should be noted that the values of this abrasion index might also vary from conventional abrasion index which is defined as the lack of resistance to abrasion of the coke after reaction with carbon dioxide in a standard CRI test. The main objective of the coke strength and abrasion measurements is to demonstrate the change in coke behaviour due to the EBF reactions.
3. Results and Discussion
In the EBF, coke undergoes many changes such as carbon structure and constituent minerals including alkali phases and porosity as discussed below. Each coke property could influence the coke behavior in an operating blast furnace particularly its strength.
3.1. Evolution of Carbon Structure
Coke carbon reacts with upcoming CO2 as coke descends into lower part of the EBF. Consequently, coke carbon content is changed at different locations in the EBF as illustrated in Fig. 3. Carbon content of lower zone coke (KL35C) is approximately 5% less than carbon content of the stock line coke (KL05C). Lower carbon contents of cokes lower EBF zones can also be attributed to increased ash content due to carbon loss as well as increased alkali uptake (Table 3).
Figure 4(a) compares the XRD patterns of cokes from three representative locations of the EBF and shows that width of 002 carbon peak of sample KL35C (cohesive zone coke) is sharper compared to the peak width of the sample KL05C (stock line coke) and KL15C (upper zone coke) of the EBF. The background intensity of sample KL35C (lower zone coke) is less than those of upper zone cokes. Low background intensity is indicative of less proportion of amorphous carbon.19) The amorphous carbon content of coke was found to decline sluggishly up to cohesive zone, and changed rapidly as the coke descended below the cohesive zone of the EBF. The results indicate that carbon structure of coke becomes increasingly ordered as the coke moves into the lower part of the EBF while the amorphous carbon is increasingly depleted.
Figure 4(b) shows that crystallite height (Lc) of coke carbon increases exponentially with the EBF height from stock line. Figure 5 shows that the Lc values of the EBF coke increases linearly with EBF temperatures. It may be noted that, normally, Lc values are not expected to increase significantly up 1200 °C due to similar range of thermal environments already experienced by coke in the coke oven. In this particularly case, it may be related to either low temperature of coking process or variation associated with estimated temperatures of the EBF in this temperature range (< 1200 °C). Many factors such as alkali and iron species could influence the changes in carbon structure of coke. However, alkalis are not expected to have a significant effect on the improvement of Lc values with increasing temperature.13) A linear correlation in Fig. 5 clearly demonstrates the strong influence of temperature on the Lc values of the coke compared to impact of increased alkali concentration of cokes in the EBF.
3.2. Evolution of Coke Ash Chemistry
In addition to carbon structure, ash chemistry of the EBF coke is also continuously changed. The chemical analysis of the EBF cokes is provided in Table 3. It may be noted that alkalis might not necessarily occur as oxides as expressed in Table 3, which is a common practice of indicating the elemental concentration of carbonaceous materials. Figure 6 illustrates the variation of alkali content of the coke ash against the EBF height. Figure 6 shows that K2O and Na2O of coke increases as the coke moves into the cohesive zone of the EBF. For example, K2O of KL35C coke was approximately 20 times of that of upper zone coke sample KL05C while the same cokes displayed approximately 10 times increase in Na2O content. Our observation of remarkable pickup of alkalis by the cokes is in agreement with previous studies.11-13) Alkali could influence the surface area, chemical structure of coke by interacting with coke in two ways either assimilating in the pores or intercalate with coke carbon as discussed before.13) In order to further understand the mode of adsorbed alkali in coke, three layers of coke samples from two locations at the opposite ends of the EBF were examined in detail by SEM/EDS.
Alkalis in coke are generally associated with aluminosilicate phases due to their origin from potassium containing clays of parent coals. Figure 7 shows the SEM images of the upper zone coke KL10C in which the alkali distribution is considered to be similar to that of the feed coke. Figures 7(a), 7(c) and 7(e) shows the features of outer, middle and inner core of the coke while Figs. 7(b), 7(d) and 7(f) provide the magnified views of the selected portion of the same parts of coke KL10C. Table 4 provides the EDS analyses of many locations inside the coke as shown by crosses and numbers in Figs. 7 and 8. Careful examination of alkali content of mineral phases of coke KL10C indicated that their alkali range was less than 4%, which is typical to that of potassium aluminosilicate often seen in the feed cokes (Figs. 7(b), 7(d), 7(f) and Table 4). The EDS analyses further suggested that range of alkali distribution of coke was not significantly altered in different sections of the coke KL10C, which could be attributed to less influence of recirculating alkalis due to less adsorption of alkalis at lower temperatures.13)
Figure 8 illustrates a similar kind of the alkali distribution in different parts of the lower zone coke KL35C. The range of alkali composition of the aluminosilicate of different sections of the coke KL35C was significantly higher being 10 to 15% (Figs. 8(b), 8(d), 8(f) and Table 4) particularly compared to similar phases in sample KL10C. Similarly to coke KL10C, the range of alkali concentration of aluminosilicate in three sections of the coke KL35C was of the same order. On the other hand, the range of alkali concentration of carbon matrix of the coke KL35C appears to have increased significantly compared to that of coke KL10C (Analysis Table 4 with C > 80 %). It appears that recirculating alkalis vapours might have been trapped by aluminosilicate of coke during penetration from external surface into the inner core of coke. At the same time, alkalis originally present in the aluminosilicate of coke might have been released and diffused uniformly into the bulk of the coke matter. Therefore, at each location of the EBF, alkali reactions appeared to have occurred throughout the carbon matrix of coke rather than preferentially accumulating at the outer layer. However, due to complexity of the heterogenity aluminisilicate composition and distribution and limited scope of the present study, further investigations are necessary to conclusively confirm the suggested alkali behavior in coke.
Visual inspection of SEM images of KL10C and KL35C did not display any apparent crack or significant differences in their macro pores. The chemical composition of the abraded portion of the externals layers of cokes was found to be similar to alkali content of the bulk coke, which implied that alkalis were as not preferentially accumulated in the external layers. Therefore, it is reasonable to infer that abrasion behaviour of the coke in this study might not necessarily be related to the increased alkali absorption by coke in the different EBF locations.
3.3. Evolution of Coke Reactivity in the EBF
Figure 9 compares the non-isothermal reactivity of the EBF coke and shows that weight loss of lower zone cokes was consistently greater compared to the weight loss of upper zone cokes. This implies that reactivity of coke increases as it descends into lower parts of the EBF. In order to further confirm the effect of furnace reactions on coke reactivity, isothermal reactivity of two representative cokes was also measured at 900 °C as illustrated in Fig. 10. The isothermal reactivity of the cohesive zone coke (KL35C) was found to be higher when compared to the reactivity of KL05C coke (stock line coke). The coke reactivity is often related to the carbon structure, surface area and coke minerals. In previous section it was shown that carbon structure of lower zone cokes was more ordered. Increased reactivity of lower zone cokes can not be attributed to the carbon structure alone as increased crystalline order of carbon often is often believed to influence the reactivity adversely.19)
Figure 11 shows that surface area of coke carbon initially increases as the coke moves towards the lower parts of the EBF, however, it starts decreasing as it approaches to the cohesive zone.
Due to non-uniform growth of surface area of the EBF coke, the consistent increased reactivity of the coke samples can not be fully attributed to carbon surface area. Higher carbon surface is often related to higher anisotropic carbon conent of the sample.22) This implies that the isotropic part of the EBF cokes was preferentially consumed due to its higher reactive nature, particulraly in the shaft region. In cohesive zone, the reactivity of anisotropic carbon of coke can be related to catalytic effect of alklais, as the alkalis content of EBF cokes increased consistently with increasing temperatures of the EBF following the same trend as displayed of the reactivity measurements of the EBF coke. It may be noted that at increased temperature greater proportion of alkalis could release from aluminosilicate slag formed inside coke. It is interesting to note that reactivity of the EBF coke could increase due to catalytic influence of alkalis even when the carbon structure is more ordered. This implies that alkalis are playing a strong role in accelerating the coke reactivity under the EBF reaction environment. These results further suggests that alkalis could increase the reactivity without modifying the crystalline order of coke carbon.
3.4. Effect of Graphitization, Alkalization and Reactivity on Coke Strength
Figures 12 illustrates that the coke strength (CSR) decreases as coke moves towards lower parts of the EBF. It may be noted that the CSR values of the EBF reacted cokes are higher than CSR value of feed coke. This is because during the CSR measurement of the EBF samples, cokes were not reacted with CO2 prior to tumbling step of the standard CSR test. The CRI component of the CSR test was omitted mainly to evaluate the impact of EBF reactions on the coke strength. Figure 12 further shows that abrasion index of lower zone cokes are higher compared to upper zone cokes. This suggests that erosion tendency of coke also increases in the EBF at higher temperatures.
Coke strength could depend on many factors including porosity and carbon structure.23-24) Figure 13 compares the optical images of KLC05 and KLC35 cokes as measured by Light Optical Microscope (LOM). Coke KLC35 displays significantly large number of bright phases (Fig. 13(b)) when compared to similar phases in the coke KLC05 (Fig. 13(a)). Greater proportion of bright phases in the cohesive zone coke could be attributed to increased degree of oxidation of isotropic carbon as the coke moved towards lower part of the EBF. The LOM images were processed to estimate the pore size data. Figure 14 shows that the percentage of macro or micro pores is not significantly decreased during the coke descent into the EBF. Despite known limitation of porosity assessments from optical image analysis, it can be clearly inferred that the porosity of coke did not increase during coke reaction inside the EBF. Consequently, it is reasonable to conclude that any subsequent reduction in coke strength might not be related to modification of coke porosity. It may be noted that total alkali load and the actual duration of contact period of coke with alkalis in a full-scale blast furnace might be different from that experienced by coke in the EBF, and hence may not necessarily have the same impact on coke strength.
Figure 15 shows the relationship between coke strength indicator i.e. coke fine index (CFI) and coke abrasion index with Lc values of coke at different locations inside the EBF. Figure 15(a) shows that the CFI decreases linearly with increasing Lc values i.e. increasing crystalline order of coke carbon. Therefore, it can be concluded that coke graphitisation has a strong influence on coke weakening inside the EBF. Figure 15(b) shows that abrasion index does not change until the Lc values exceed more than 30 A. This means that the relationship between carbon structure and abrasion is more apparent at higher temperatures of the EBF as the Lc value of coke exceeds more than 30 A in a temperature range of 1400 °C (Fig. 5). This implies that coke might not abrade until it goes through certain minimum degree of graphitisation. Figure 16 shows the relationship between coke strength indicator namely coke fine index (CFI) and coke abrasion index with potassium content of coke at different locations inside the EBF. Figure 16(a) shows that initially coke strength i.e. CFI decreases with potassium content of coke. However, potassium content of coke can not be clearly related to reduction in coke strength once it exceeds 20 % i.e. which occurs in the lower parts of the EBF. The abrasion index is not influenced by the potassium content of coke until it exceeds more than 20 % as shown in Fig. 16(b). On the basis of results in Figs. 15 and 16, one can conclude that carbon structure of coke provides a consistent correlation with coke deterioration in the EBF such that the increased graphitisation accelerates coke weakening as well as abrasion. On the other hand, the reactivity of coke was consistently increased as it descended into the EBF, however it did not display any evidence of cracks/fissures or change is porosity. This implies that coke reactivity might not have a significant impact on the coke weakening in the EBF. The EBF observations are consistent with previous studies in which graphitisation was linked to coke degradation.24,25)
The study suggests that coke alkalis catalyse the reactivity but might not have a strong effect on coke graphitisation and hence on coke strength. The study has significant implications for understanding the effect of coke properties on its performance in a blast furnace particularly in understanding the influence of coke minerals on coke performance in an operating blast furnace. While iron species are well known to simultaneously catalyse coke reactivity and coke graphitisation,24) this study implies that alkalis could catalyse coke reactivity without graphitising. However, further studies are required to establish the predominant factors affecting coke weakening in an operating blast furnace. The strong effect of coke graphitisation on fine generation needs to be validated by blast furnace operating experiences based on wide variety of cokes.
4. Conclusions
A high CSR coke was tested in an experimental blast furnace. Physical and chemical properties of cokes samples from the EBF were measured. Evolution of coke properties particularly carbon structure and alkali uptake were related to CO2 reactivity as well as coke behaviour (e.g. CSR/abra-sion). On the basis of this study, following conclusions were made.
(1) The order of carbon structure and concentration of alkali species were increased, and were found to be the most notable changes in the coke properties as it passed through thermal reserve zone to the cohesive zone of the EBF.
(2) The height of the carbon crystallite (Lc) of coke was increased while amorphous carbon content was decreased in the hotter zones of the EBF. A linear correlation between the Lc values and the coke bed temperature was established to demonstrate the strong effect of temperature on the carbon crystallite (Lc) of coke in the EBF.
(3) The alkali concentration of coke was increased with increasing temperature of the coke bed such that most of the alkalis were evenly distributed in the bulk coke rather than in the external coke layer.
(4) The CO2 reactivity of coke was found to increase during progressive movement of the coke from the thermal reserve zone to cohesive zone of the EBF, and was related to the catalytic effect of increased alkali concentration in coke. The results imply that alkalis could catalyse the coke reactivity without having any strong effect on graphitisation or possibly any adverse effect on fines generation.
(5) The deterioration of coke quality particularly coke strength and abrasion propensity are related to the coke graphitisation, alkalization and reactivity. The coke graphitisation is shown to have a strong effect on the coke degradation behaviour.
Acknowledgements
The authors would like to thank MEFOS Metallurgical Research Institute AB and LKAB for providing the samples and the opportunity to conduct this research, Jernkontoret and Swedish Energy Agency for financial support. A part of this work was undertaken as part of the Cooperative Research Centre for Coal in Sustainable Development (CCSD) Research Program 5.1 (Ironmaking). Authors would also like to appreciate help provided by Mr. N. Saha-Chaudury and other staff at the University of New South Wales for their assistance in using equipment and facilities.
REFERENCES
1) Coke—Determination of Coke Reactivity Index (CRI) and Coke Strength after Reaction (CSR): ISO/DIS 18894, (2001).
2) Annual Book of ASTM Standards, Section 5: Petroleum Products, Lubricants and Fossil Fuels, vol. 05.05, ASTM, Philadelphia, (1996).
3) K. H. Grosspietsch, H. B. Lungen, G. Dauwels, Ferstl, T. Karjalahti, P. Negro, B. van der Velden and R. Willmers: Proc. 4th European Coke and Ironmaking Cong., Vol. 1, ATS-RM, Paris, (2000), 1.
4) P. Arendt, F. Huhn and H. Kiihl: Cokemaking Int., 2 (2001), 50.
5) H. Sato, J. W. Patrick and A. Walker: Fuel, 77 (1998), 1203.
6) R. R. Willmers and C. R. Bennington: Proc. 2nd Int. Cokemaking Cong., The Institute of Materials, London, UK, (1992), 260.
7) B. Feng, S. K. Bhatia and J. C. Barry: Carbon, 40 (2002), 481.
8) M. Helleisen, R. Nicolle, J. M. Steiler, N. Jusseau, C. Meltzheim and C. Thiriom: Proc. 1st Int. Cokemaking Cong., Verlag Gluckauf, Essen, Germany, (1987), C2.1.
9) S. Forsberg: Proc. 1st Int. Cokemaking Cong., Verlag Gluckauf, Essen, Germany (1987), C6.1.
10) B. van der Velden: McMaster Cokemaking Course, McMaster University, Hamilton, (2003), 22.1.
11) J. M. Steiler, R. Nicolle, P. Negro, M. Helleisen, N. Jusseau, B. Metz and C. Thirion: Ironmaking Conf. Proc., ISS, Warrendale, PA, (1991), 715.
12) J. Tucker and J. Goleczka: Proc. 1st Int. Cokemaking Cong., Verlag Gluckauf, Essen, Germany, (1987), C5.1.
13) B. K. C. Chan, K. M. Thomas and H. Marsh: Carbon, 31 (1993), 1071.
14) E. Beppler, B. Gerstenberg, U. Jahnsen and M. Peters: Cokemaking Int., 2 (1994), 15.
15) H. W. Gudenau: Proc. First Int. Cong, of Science and Technology of Ironmaking, ISIJ, Tokyo, (1994), 348.
16) A. Dahlstedt, M. Hallin and M. Tottie: SCANMET, Lulea, Sweden, (1999), 235.
17) A. Dahlstedt, M. Hallin and J.-O. Wikstrom: Proc. 4th European Coke and Ironmaking Cong., Vol. 1, ATS-RM, Paris, (2000), 138.
18) L. Hooey, J. Sterneland and M. Hallin: 60th Ironmaking Conf. Proc., ISS, Warrendale, PA, (2001), 197.
19) L. Lu, V Sahajwalla, C. Kong and D. Harris: Carbon, 39 (2001), 1821.
20) V Sahajwalla, M. Dubikova and R. Khanna: Proc. Tenth Int. Ferroalloys Cong., SAIMM, Marshalltown, (2004), 35.
21) B. D. Cullity: Elements of X-ray Diffraction, Addison-Wesley Publishing, (1978).
22) O. Kerkkonen, P. Arendt and H. Kuhl: 61st Ironmaking Conf. Proc., ISS, Warrendale, PA, (2002), 393.
23) J. A. Vandezande: 44th Ironmaking Conf. Proc., ISS, Warrendale, PA, (1985), 189.
24) J. V Dubrawaski and W. W. Gill: Ironmaking Steelmaking, 1 (1984), 7.
25) Y. Kashiwaya, M. Takahata, K. Ishii, K. Yamaguchi, M. Naito and H. Hasegawa: Tetsu-to-Hagane, 87 (2001), No. 5, 259.