The biography The biography
Library
Links
The report on search
The individual task
|
|
| ACTIVIZATION OF INNOVATIVE ACTIVITY
Aiko Oleg |
Urgency:  |
The basic material in master's work is devoted to a problem of set of alternatives of investment of temporarily free capital. Now in Ukraine gets the urgency asset managment. Or share investment funds. From set of funds offered in Ukraine, the method of definition of the best funds for asset managment funds.
The urgency of market asset managment at the given stage of development of Ukraine is obvious. As all of them show profitableness considerably exceeding bank deposits. Depending on type of funds, profitableness of some funds from the beginning of 2007 reached 150 %. Certainly profitableness of the most popular opened allocations is much lower, but all the same is at a level of 40%-90 %. As it is necessary to note, that in the countries with the advanced market of 90 % of all contributions are in asset managment.
The purposes and tasks of work:
To investigate the market of Ukraine of share investment funds and as to offer the technique of drawing up of ratings of investment funds in Ukraine.
|

At management of risks and an estimation of efficiency of an investment portfolio it is necessary to expect factors Sharp, the Alpha, Beta.
The Sharpe ratio or Sharpe index or Sharpe measure or reward-to-variability ratio is a measure of the excess return (or Risk Premium) per unit of risk in an investment asset or a trading strategy. Since its revision made by the original author in 1994, it is defined as: 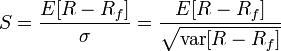
| | |
|
Jensen's alpha
In finance, Jensen's alpha (or Jensen's Performance Index, ex-post alpha) is used to determine the excess return of a stock, other security, or portfolio over the security's required rate of return as determined by the Capital Asset Pricing Model. This model is used to adjust for the level of beta risk, so that riskier securities are expected to have higher returns. The measure was first used in the evaluation of mutual fund managers by Michael Jensen in the 1970's.
To calculate alpha, the following inputs are needed:
the realized return (on the portfolio),
the market return,
the risk-free rate of return, and
the beta of the portfolio.
Jensen's alpha = Portfolio Return - (Risk Free Rate + Portfolio Beta * (Market Return - Risk Free Rate))
 Alpha is a risk-adjusted measure of the so-called active return on an investment. It is a common measure of assessing an active manager's performance as it is the return in excess of a benchmark index. Note that the term "active return" refers to the return over a specified benchmark (e.g. the S&P500), whereas "excess return" refers specifically to the return over the risk-free rate. It is a common error to confound these two terms, and the reader is cautioned to make a careful distinction between them when studying or discussing investments. Alpha is a risk-adjusted measure of the so-called active return on an investment. It is a common measure of assessing an active manager's performance as it is the return in excess of a benchmark index. Note that the term "active return" refers to the return over a specified benchmark (e.g. the S&P500), whereas "excess return" refers specifically to the return over the risk-free rate. It is a common error to confound these two terms, and the reader is cautioned to make a careful distinction between them when studying or discussing investments.
The alpha coefficient (?i) is a parameter in the capital asset pricing model. In fact it is the intercept of the Security Characteristic Line (SCL). One can prove that in an efficient market, the expected value of the alpha coefficient equals the return of the risk free asset: E(ai) = rf.
Therefore the alpha coefficient can be used to determine whether an investment manager or firm has created economic value:
ai < rf: the manager or firm has destroyed value
ai = rf: the manager or firm has neither created nor destroyed value
ai > rf: the manager or firm has created value
beta coefficient
This article discusses the beta coefficient as used in economics. For the statistical term often used in regression, see standardized coefficient.
The beta coefficient, in terms of finance and investing, describes how the expected return of a stock or portfolio is correlated to the return of the financial market as a whole.[1]
An asset with a beta of 0 means that its price is not at all correlated with the market; that asset is independent. A positive beta means that the asset generally follows the market. A negative beta shows that the asset inversely follows the market; the asset generally decreases in value if the market goes up.
Correlations are evident between companies within the same industry, or even within the same asset class (such as equities), as was demonstrated in the Wall Street crash of 1929. This correlated risk, measured by Beta, creates almost all of the risk in a diversified portfolio.
The beta coefficient is a key parameter in the capital asset pricing model (CAPM). It measures the part of the asset's statistical variance that cannot be mitigated by the diversification provided by the portfolio of many risky assets, because it is correlated with the return of the other assets that are in the portfolio. Beta can be estimated for individual companies using regression analysis against a stock market index.
The formula for the Beta of an asset within a portfolio is 
where ra measures the rate of return of the asset,
rp measures the rate of return of the portfolio of which the asset is a part and Cov(ra,rp) is the covariance between the rates of return.
the CAPM formulation, the portfolio is the market portfolio that contains all risky assets, and so the rp terms in the formula are replaced by rm, the rate of return of the market.
Beta is also referred to as financial elasticity or correlated relative volatility, and can be referred to as a measure of the sensitivity of the asset's returns to market returns, its non-diversifiable risk, its systematic risk or market risk. On an individual asset level, measuring beta can give clues to volatility and liquidity in the marketplace. On a portfolio level, measuring beta is thought to separate a manager's skill from his or her willingness to take risk.
The beta movement should be distinguished from the actual returns of the stocks. For example, a sector may be performing well and may have good prospects, but the fact that its movement does not correlate well with the broader market index may decrease its beta. However, it should not be taken as a reflection on the overall attractiveness or the loss of it for the sector, or stock as the case may be. Beta is a measure of risk and not to be confused with the attractiveness of the investment.
|
|
The result of research , is methods of drawing up of ranging of share investment funds proceeding from the various data.
The dissertation has survey character and is not the full version master's dissertations since continuation of work above the dissertation during an autumn semester 2008 is planned.

The asset management companies
Liders of Ukraine investment funds
(anim.gif 10 times. 80kb)
| | Library |
1. Про інститути спільного інвестування (пайові та корпоративні інвестиційні фонди): ЗАКОН УКРАЇНИ вiд 15.03.2001 № 2299-III [Електрон.
ресурс]. – Режим доступу: http://www.rada.gov.ua
2. Эрдман Г.В. 1000% за 5 лет, или правда о паевых инвестиционных фондах. – М. : НТ Пресс,2007. – 66 с.
3. Эрдман Г.В. Как обыграть рынок,инвестируя в ПИФы. – М. : НТ Пресс,2007. – 60 с.
4. ТОП 20 ПИФов//Деловой. – 2007. - №8. – c. 32-40.
5. Березанская Е. ПИФы//Forbes(Россия). - 2008. - №2. - с. 162-163.
6. Барановский Д.К. «Все, что нужно знать инвестору о паевых инвестиционных фондов» М.: Альпина Бизнес Букс, 2007 – 68с.
7. Данные о рыночных котировках акций [Електрон. ресурс]. – Режим доступу: http://www.pfts.com.ua
8. Уоррен Баффет «Эссе об инвестициях, корпоративных финансах и управлениями кампаниями» М.: Альпина Бизнес Букс, 2005 -268 с.
9. Шапран В.,Корнелюк Р. Фондовая альтернатива//ЭКСПЕРТ. - 18.02.2008 - №7 – c. 41-48.
10. Шапран В.,Духненко В. ПИФы на марше//ЭКСПЕРТ. - 04.06.2007 - №27 – c. 69-76.
11. Шарп У. Ф., Александер Г. Д., Бэйли Д. В. Инвестиции. – М.: Инфра-М, 1997.
|
|