Chapter 6 Trends in Land Ownership and Land
Transactions
| Section 1 |
Trends in Land
Ownership |
1. Land Ownership by the Private Sector
(Current Status of Land
Ownership by Individuals and Corporations)
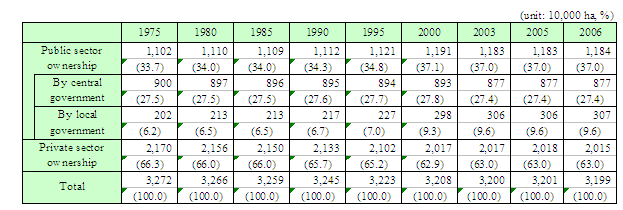
Approximately 85% of the total land area in Japan falls into two
categories: "developed land/agricultural land" and "forestry/fields". In
Fiscal Year 2006, 37% was owned by the public sector (27% by the Central
Government and 10% by local government); and 63% by the private sector
(see Chart 6-1-1)
Chart6-1-1 Land Ownership
("Developed Land and
Agricultural Land" and "Forestry and Fields") by Sector |
 |
Source: Calculated by Ministry of Land, Infrastructure,
Transport and Tourism from "Monthly Report of Statistics of Fiscal and
Financial Figures" by Ministry of Finance, and "Survey of Current Status
of Public Utilities" by Ministry of Internal Affairs and
Communications
Note1: Public sector ownership is calculated from
"Monthly Report of Statistics of Fiscal and Financial Figures" and "Survey
of Current Status of Public Utilities". Private sector ownership is
calculated by deducting areas of public sector ownership from the total
which was researched by the Ministry of Land, Infrastructure, Transport
and Tourism.
Note2: Figures represent areas as of March 31 of each
year.
Note3: The total area of Japan includes streets and roads that
are not shown in the. These account for approximately 5.80 million ha
(14.28 million acres). In 2006, the total area of Japan was 37.79 million
ha (93.38 million acres). |
As of 1 January
2007, 85.6% of land owned by the private sector was held by individuals
and 14.4% by corporations (see Chart
6-1-2).
| Chart 6-1-2 Proportions of Land Ownership by
Individuals and Corporations (by Land Use) |
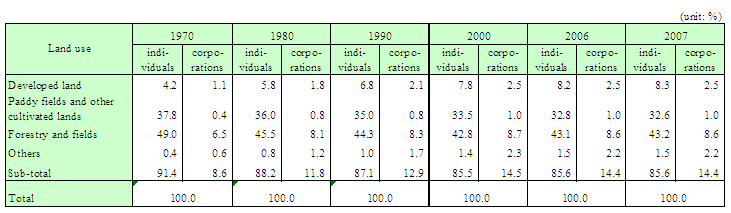 |
Source: "General Report of Prices of Fixed Assets"
Ministry of Internal Affairs and Communications
Note 1: Proportions
are based on land areas exceeding tax exemption.
Note 2: Stock farms
are included in paddy fields and other cultivated lands.
Note 3:
Others includes salt fields, lands of mineral springs and lakes.
Note
4: Figures are as of January 1 of every
year. |
As for the regional situation, in the Metropolitan areas (i.e.
the 23 wards in Tokyo and the other Cabinet Ordinance Designated Cities),
26.0 % of all such land was owned by corporations. The proportions of land
owned by corporations are higher in the Metropolitan areas (see Chart
6-1-3).
Chart 6-1-3 Proportion of Land Ownership by
Individuals and Corporations
(in 2007) |
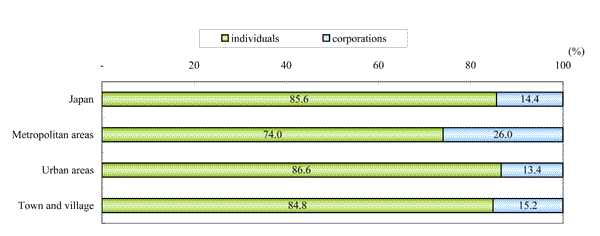 |
Source: Calculated by Ministry of Land, Infrastructure,
Transport and Tourism from "General Report of Prices of Fixed Assets"
Ministry of Public Management, Home Affairs, Posts and Telecommunications
Note1: Proportions are based on land areas exceeding tax exemption
Note2: Figures are as of January 1 of every year.
Note3: Regions
are as follows:
Metropolitan areas: the areas of 23 wards in Tokyo and
the Cabinet Ordinance Designated Cities
Urban areas: areas within
cities other than the Cabinet Ordinance Designated Cities
Town and
village: areas occupied by towns and villages in
Japan |
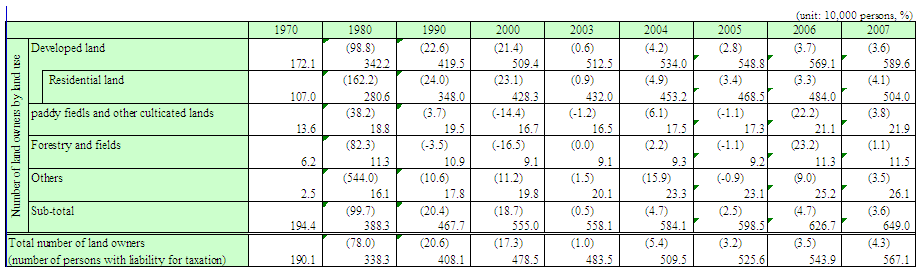
(Trends in the Number of Landowners)
The number of
landowners in Japan in 2007 was 38.74 million. By land use, the number of
owners of developed land was 32.95 million. Owners of residential land (a
sub-category within developed land) comprised 27.07 million. The number of
owners of paddy fields and other cultivated lands was 9.92 million, and of
forestry and fields 5.42 million (see Chart 6-1-4).
The number
of landowners in the Metropolitan areas was 5.67 million. By land use, the
number of land owners of developed land amounted to 5.90 million (see
Chart 6-1-5).
| Chart 6-1-4 Trends in the Number of Landowners by Land
Use (in Japan) |
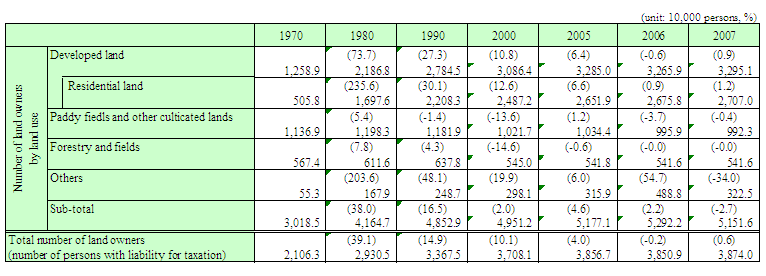 |
Source: Calculated by Ministry of Land, Infrastructure,
Transport and Tourism from "General Report of Prices of Fixed Assets"
Ministry of Internal Affairs and Communications
Note1: For residential
lands, figures of normal residential land for 1970, and of small
residential land for years on and after 1980 were used.
Note2: Stock
farms are included in paddy fields and other cultivated lands. Others
include salt fields, lands of mineral springs and lakes.
Note3:
Figures in upper columns are the change ratios indicated in the columns on
the left. Note4:"The number of landowners by land use" is the number of
owners of land exceeding tax exemptions. When one person holds land
categorized under different uses, that person is counted as one person in
each land use category. Also when one person holds land in two and more
different cities, towns land villages, that person is counted as one
person in each land use category in each city, town and village."The
number of land owners" is the number of persons with liability for
taxation of fixed assets of land. When one person holds more than two
areas of land under different land use in each city, town and village, the
person is counted as one person, but where he holds land in more than two
different cities, towns and villages, that person is counted as one person
in each city, town and village. Therefore, the actual number of landowners
is smaller than "the number of land owners" in this
chapter
Note4: "The number of landowners by land
use" is the number of owners of land exceeding tax exemptions. When one
person holds land categorized under different uses, that person is counted
as one person in each land use category. Also when one person holds land
in two and more different cities, towns and villages, that person is
counted as one person in each land use category in each city, town and
village. "The number of land owners" is the number of persons with
liability for taxation of fixed assets of land. When one person holds more
than two areas of land under different land use in each city, town and
village, the person is counted as one person, but where he holds land in
more than two different cities, towns and villages, that person is counted
as one person in each city, town and village. Therefore, the actual number
of landowners is smaller than "the number of land owners" in this
chapter. |
| Chart 6-1-5 Trends in the Number of Landowners by Land
Use (in Metropolitan Area) |
 |
Source: same as chart 6-1-4
Note: same as chart
6-1-4 |
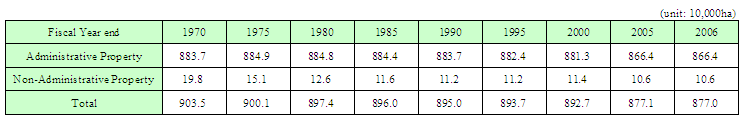
2 Land Owned by the Public Sector
(Current Status of Land Owned
by Central Government)
By the end of Fiscal Year 2006 (end of
March 2007), the area of land registered on the Asset Registration Sheet
of the Central Government (i.e. land owned by the Central Government) was
8.770 million ha (21.67 million acres), representing 23.2% of total area
of Japan (see Chart 6-1-6). Lands owned by Central Government are
categorized into two types: lands owned for the purpose of Central
Government administrative activities (Administrative Property) and lands
owned for other purposes (Non-Administrative
Property). |
| Chart 6-1-6 Trends in Central Government Assets
(Land) |
 |
Source: "Comprehensive Statements of Increase and
Decrease and Current Value of National Property" by Ministry of Finance
Note: Area figures are rounded to omit fractions. Therefore, the total
figures in each column and the areas in the charts do not necessary
correlate. |
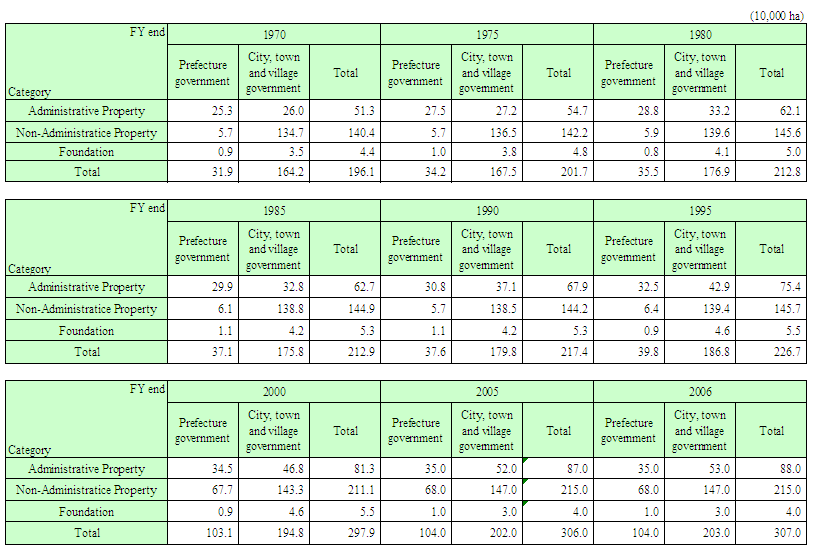
(Current Status of Land Owned by Local Government)
As
at the end of Fiscal Year 2006 (end of March 2007), land owned by local
government (including land owned by the Foundation of Land Development
(tochi-kaihatsu-kikin) etc) totaled 3.070 million ha (7.586 million
acres), of which 1.040 million ha (2.570 million acres) was owned by
prefecture governments and 2.030 million ha (5.016 million acres) was
owned by city, town and village governments, representing 8.1% of total
area of Japan (2.8% by the land owned by prefecture governments and 5.3%
by the land owned by city, town and village governments) (see Chart
6-1-7).
| Chart 6-1-7 Current Status of Land Owned by Local
Government (Areas) |
 |
Source: "Survey of Public Facilities" by Ministry of
Internal Affairs and Communications
Note: Land for streets, bridges,
rivers, seashore, port and harbor, and ports for fisheries is not
included. |
3. Current Status of Value of Assets of Land
The value
of assets of land in 2006 was JPY 1,228.0 trillion (an increase of 0.5 %
on the previous year) based on "Annual Report on National Accounts" (Chart
6-1-8). |
| Chart 6-1-8 Trends of Value of Land classified by
Institutional Sectors |
 |
Source: "Annual Report on National Accounts" by Cabinet
Office
Note: Figures in ( ) represents total net buying (total net
selling) in each year |
| Section 2 |
Land
Transactions | |
1. Trends in Land Transactions
(Land Transactions by Purchase
and Disposal)
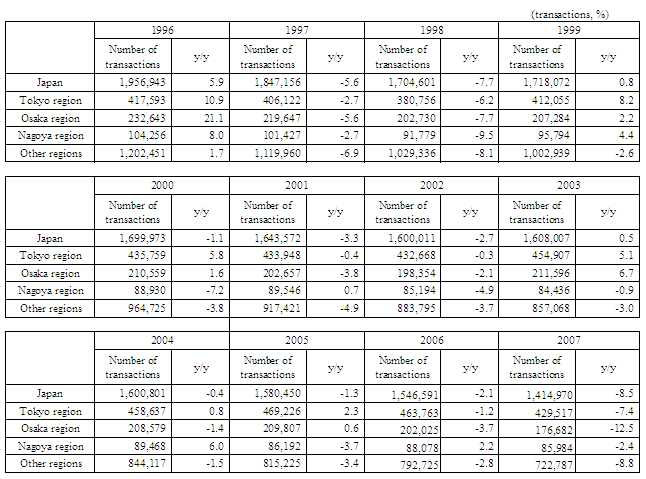
The number of land transactions (i.e. the
number of freehold land transfer registrations) undertaken through
purchase and disposal was 1,414,970 in 2007, a decline of 8.5 % compared
to the previous year (see Chart 6-2-1). |
| Chart 6-2-1 Trends in the Number of Land Transactions
by Purchase and Disposal |
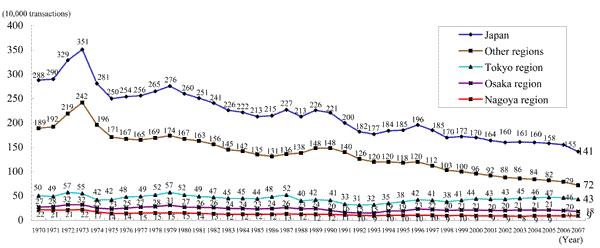 |
Source: "Annual Statistics of Civil Affairs, Litigation
and Human Rights" Ministry of Justice
Note: Areas are as follows:
Tokyo region: Saitama, Chiba, Tokyo and Kanagawa Prefecture
Osaka
region: Osaka, Kyoto and Hyogo Prefecture
Nagoya region: Aichi and Mie
Prefecture
Other regions: areas other than the above |
 |
(Current Status of Transaction Parties)
In terms of
total land disposals by parties, of the total areas of land disposals, in
2006 transactions involving individuals comprise about 33 %; while those
involving corporations account for about 64 % (see Chart
6-2-2).
As for those parties involved in the purchase of land, in
2006 the areas of corporations purchasing land were 67%; while the areas
of individuals doing so were 26 % (see Chart
6-2-3).
| Chart 6-2-2 Current Status of Parties of Land Disposal
(Areas) |
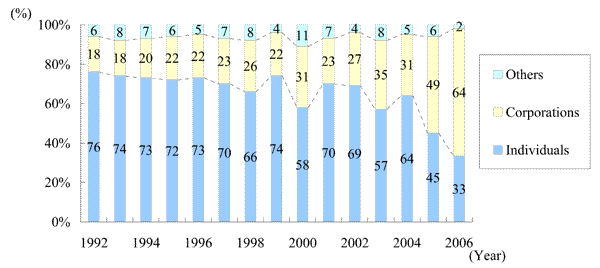 |
Source: Preliminary analyze report from "Land Ownership
Transfer Survey" by Ministry of Land, Infrastructure, Transport and
Tourism
Note: The analysis was conducted on the basis of land
transactions selected by random sampling, with a sampling rate of one in
50 transactions, from among land transactions conducted across Japan
concerning which ownership transfer was
registered. |
| Chart 6-2-3 Current Status of Parties to Land
Purchases (Areas) |
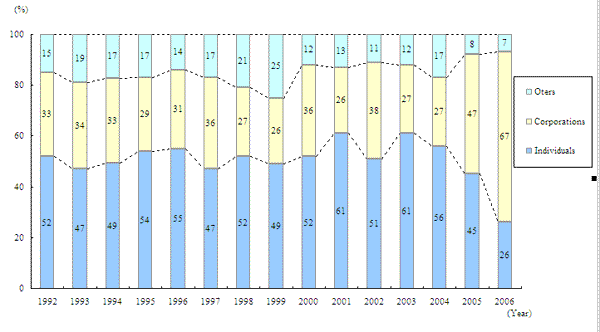 |
Source: Preliminary analyze report from "Land Ownership
Transfer Survey" by Ministry of Land, Infrastructure, Transport and
Tourism
Note: The analysis was conducted on the basis of land
transactions selected by random sampling, with a sampling rate of one in
50 transactions, from among land transactions conducted across Japan
concerning which ownership transfer was
registered.Ѓ@ |
(Current Status of Vendors and Purchasers in Land
Transactions)
With regard to the status of vendors and
purchasers, in proportional number terms in 2006, transactions between
"individuals to individuals" decreased (see Chart 6-2-4).
On the other
hand, in proportional area terms, transactions "individuals to
individuals" decreased, (see Chart
6-2-5).
Chart 6-2-4 Status of Vendors and Purchasers in Land
Transactions
(by the number of transactions) |
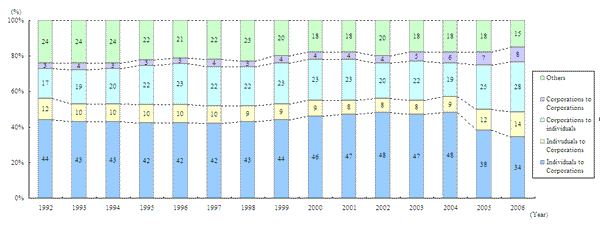 |
Source: Preliminary analyze report from "Land Ownership
Transfer Survey" by Ministry of Land, Infrastructure, Transport and
Tourism
Note: The analysis was conducted on the basis of land
transactions selected by random sampling, with a sampling rate of one in
50 transactions, from among land transactions conducted across Japan
concerning which ownership transfer was
registered. |
| Chart 6-2-5 Status of Vendors and Purchasers in Land
Transactions (by Area) |
 |
Source: Preliminary analyze report from "Land Ownership
Transfer Survey" by Ministry of Land, Infrastructure, Transport and
Tourism
Note: The analysis was conducted on the basis of land
transactions selected by random sampling, with a sampling rate of one in
50 transactions, from among land transactions conducted across Japan
concerning which ownership transfer was
registered. |
| Section 3 |
Size of Land Investment classified
by Institutional
Sectors | |
With regard to size of land investment by institutional sectors,
according to "Annual Report on National Accounts", General Government was
net buyers and Household, Non-financial Corporations and Financial
Corporations were net sellers in 2006 (see Chart
6-3-1).
| Chart 6-3-1 Trends of Size of Land Investment
classified by Institutional Sectors |
 | | |