Heart Rate Variability Predicts Severe Hypotension after Spinal Anesthesia for Elective Cesarean Delivery
Background: Hypotension due to vasodilation during subarachnoid block (SAB) for elective cesarean delivery may be harmful. Heart rate variability (HRV), reflecting autonomic control,
may identify patients at risk of hypotension.
Methods: Retrospectively, HRV was analyzed in 41 patients who were classified into one of three groups depending on the decrease in systolic blood pressure (SBP): mild (SBP > 100 mmHg), moderate (100 > SBP > 80 mmHg), or severe (SBP < 80 mmHg). Prospectively, HRV and hemodynamic data of 19 patients were studied. Relative low frequency (LF), relative
high frequency (HF), and LF/HF ratio were analyzed.
Results: Retrospective analysis of HRV showed a significantly higher sympathetic and lower parasympathetic drive in the groups with moderate and severe compared with mild hypotension
before SAB (median, 25th/75th percentiles): LF/HF: mild: 1.2 (0.9/1.8), moderate: 2.8 (1.8/4.6), P < 0.05 versus mild; severe: 2.7 (2.0/3.5), P < 0.05 versus mild. Results were confirmed
by findings of LF and HF. Prospectively, patients were grouped according to LF/HF before SAB: low-LF/HF: 1.5 (1.1/2.0) versus high-LF/HF: 4.0 (2.8/4.7), P < 0.05; low-LF: 58 _
9% versus high-LF: 75 _ 10%, P < 0.05; low-HF: 41 _ 10% versus high-HF: 25 _ 10%, P < 0.05. High-risk patients had a significantly lower SBP after SAB (76 _ 21 vs. 111 _ 12 mmHg;
P < 0.05).
Conclusions: Retrospectively analyzed HRV of patients scheduled to undergo elective cesarean delivery during SAB showed significant differences depending on the severity of hypotension
after SAB. Preliminary findings were prospectively confirmed. High LF/HF before SAB predicted severe hypotension. Preoperative HRV analysis may detect patients at risk of hypotension after SAB.
MORBIDITY and mortality directly related to anesthesia for cesarean delivery has decreased in past decades to 1.7 per million.1 The higher risk of maternal complicationsassociated with general anesthesia compared with regional anesthesia has led to an increased use of subarachnoid block (SAB) and epidural anesthesia (EDA) for both elective and emergency cesarean delivery.2 Although SAB is generally well tolerated, hypotension is a common adverse effect of SAB in some patients.3 Hypotension during central neuroaxial block is mainly a result of decreased systemic vascular resistance after blockade of preganglionic sympathetic fibers. In pregnant women, it was demonstrated that sympathetic regulation is increased as compared with that of nonpregnant women. 4-6 Further differences of the regulation of the autonomic nervous system (ANS) among healthy pregnant patients may explain hemodynamic differences in response to AB.
Vasovagal episodes in association with regional anesthesia are not rare; rates of up to 90% have been reported. 7,8 Anesthesia-induced hypotension may have severe adverse effects for mother and child. No strategy of preventing the relative hypovolemia caused by regional anesthesia-intravenous crystalloids and colloids as well as prophylactic intramuscular or intravenous vasopressors has proved entirely satisfactory and applicable to all patients.9,10 Preoperative determination of the ANS control might provide an opportunity to detect patients at risk of severe hemodynamic impairment.
Systemic hemodynamics are modulated by the ANS.11 A noninvasive method of measuring the activity of the ANS is the analysis of heart rate variability (HRV).12 Several studies have investigated the influence of general and regional anesthesia on HRV,11,12 but to date, only
one study included patients for elective cesarean delivery during SAB.13 There has been no investigation studying the predictive value of HRV on hemodynamic parameters
after regional anesthesia.
We hypothesized that (1) retrospectively analyzed preoperative HRV may differ between patients in relation to the severity of hypotension after SAB, (2) prospectively analyzed HRV can predict hypotension after SAB, and (3) HRV may identify patients in whom prehydration would
be beneficial.
Materials and Methods
After approval of the Institutional Ethics Committee of the University-Hospital Schleswig-Holstein, Campus Kiel, Germany, and written informed consent, 60 women (American Society of Anesthesiologists physical status class I or II) with an uneventful pregnancy, at term, scheduled to undergo elective cesarean delivery during SAB, were studied. Exclusion criteria were as follows: signs of active labor; gestational or chronic hypertension; preeclampsia; hypertension, elevated liver enzymes, and low platelets syndrome; coexisting infections; bleeding disorder; emergency cases; age less than 18 yr; and known fetal abnormalities. All preanesthetic laboratory values were within normal limits. All women showed sinus rhythm, normal heart rate (HR; _ 110 min_1), and stable blood pressure (100 mmHg _ systolic blood pressure [SBP] _ 140 mmHg, 50 mmHg _ diastolic blood pressure _ 90 mmHg) on the day before surgery (DBS). Patients received no premedication and no intravenous fluids before entering the study.
HRV Measurements
Three HRV analyses were performed, all of them before SAB: (1) on the DBS; (2) on the day of surgery (DOS), baseline before prehydration (DOS-BL); and (3) on the DOS after prehydration. HRV analysis was performed according to the Task Force recommendations.14 Five-minute recordings of the fast peaks of R waves on the electrocardiogram were detected with a sampling
rate of 1,024 Hz. The beat-to-beat variability of consecutive R waves of the sinus rhythm was measured. Data were analyzed by a personal computer using fast Fourier transformation (Vario Cardio TF4; Olomuk, Czech Republic).
Power spectrum densities were calculated for low frequency (LF; 0.04-0.15 Hz) and high frequency (HF; 0.15- 0.4 Hz) in normalized units, defined as either LF's or HF's relative part of the total power. LF is thought to reflect sympathetic and parasympathetic control, whereas HF reflects parasympathetic control.15 The ratio of absolute values of LF and HF (LF/HF) was reported to correlate with sympathovagal balance16; this parameter was also calculated for each group. Because fast Fourier transformation analysis requires stationary collection of the data, patients were ask to lay calmly in the supine position with left uterine displacement during measurements. R-R intervals were measured and stored on a personal computer continuously in all patients. Artifacts were eliminated by computer-based artifact detection followed by an evaluation by an expert blinded to the study results. Beats were rejected if they varied more than 40% from the preceding beat. These intervals were replaced by the mean of the previous and consecutive R-R intervals. At most, 5% of a specific measurement was allowed to be replaced. Otherwise, this specific measurement was not included in the analysis.
Spinal Anesthesia
All patients received rapid infusion of 500 ml hydroxyethyl starch 6%/130/0.4 (Voluven®; Fresenius Kabi, Bad Homburg, Germany) as prehydration according to textbook recommendations.17 Thereafter, standardized SAB was performed: The puncture site was interlumbar space L2-L3 or L3-L4, with the patient in a sitting position. Hyperbaric bupivacaine, 12.5 mg (0.5%), was injected via a 25-gauge Sprotte needle with the side port
of the needle pointing cephalad. The level of sensory blockade was aimed at T4-T5. Immediately after injection, patients were positioned supine with left uterine displacement. Oxygen (5 l/min) was administered via facemask. The level of sensory blockade was tested by
pinprick test.
Cardiovascular Monitoring
Systolic blood pressure, HR, and oxygen saturation were recorded at DBS and at DOS. Five different events were defined for hemodynamic measurements. Time 1 was defined as DBS; time 2 was DOS-BL; time 3 was DOS after prehydration; and time 4 was the first measurement
after SAB, with the patient positioned supine with left uterine displacement. After SAB, hemodynamic parameters were measured minute by minute until SAB was fixed and SBP remained stable. Time 5 was defined as the lowest value between onset of SAB and delivery of the newborn (event Low). The time period between onset of SAB and delivery of the newborn was recorded as well as the interval between onset of SAB and measurement of lowest SBP.
Group Assignment
Group Assignment
This study was performed in two steps. First, patients were classified into one of three groups by the lowest SBP as follows: Patients with an SBP greater than 100 mmHg were included in the mild group, patients with an SBP of 80-100 mmHg were included in the moderate group, and patients with an SBP less than 80 mmHg were included in the severe group. HRV was analyzed retrospectively depending on the patient's classification. Second, based on the preliminary data, a predictive model was built to confirm our hypothesis prospectively in another group of patients. Based on the retrospective data, a cutoff point of the LF/HF ratio was defined. Two prospective groups were defined: a low-LF/HF group (LF/HF _ 2.5) and a high-LF/HF group
(LF/HF _ 2.5). SBP and HR were analyzed as described above.
In all patients, hypotension and bradycardia were treated in a standardized manner if necessary. If SBP was greater than 100 mmHg and HR was greater than 60 beats/min, no treatment was given. If SBP was between 80 and 100 mmHg or HR was less than 60 beats/min, rapid infusion of another 500 ml hydroxyethyl starch was administered for treatment of hypotension or 0.5 mg atropine was administered for treatment of bradycardia. If SBP and HR increased to "no treatment" levels, no further therapy was administered. If SBP remained below 100 mmHg, an intravenous vasopressor bolus (0.5 ml Akrinor; AWD Pharma, Dresden, Germany; 0.5 ml _ 50 mg cafedrin-1HCl, 2.5 mg theodrenalin-HCl) was given. A maximum of 1 ml of the vasopressor was injected. Moderate group patients who required further vasopressor boluses were included in the severe group. Persistent bradycardia was treated with a second bolus of 0.5 mg atropine. If moderate group patients received more then 1 mg atropine, they were included in the severe group. An SBP less than 80 mmHg was treated with intravenous vasopressor boluses of 0.5 ml and simultaneous rapid infusion of 500 ml hydroxyethyl starch until SBP increased to 100 mmHg. After surgery, all patients remained in the delivery department and were monitored until SAB diminished completely. Data were analyzed using standard software (PRISM GraphPad Software, San Diego, CA). All numeric data were checked for normal distribution using the Kolmogorov-Smirnov test. Normally distributed data and normalized HRV data during different events were analyzed using two-way analysis of variance factoring for event and LF/HF ratio. Within-group differences over time were analyzed using one-way analysis of variance followed by the Bonferroni correction for multiple comparisons. Differences between groups were analyzed using an unpaired Student t test. All parametric data are expressed as mean _ SD, and nonparametric data are expressed as median, 25th/75th percentiles, and range. A value of P _ 0.05 was considered statistically significant.
Results
Demographics
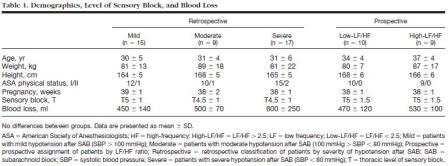
A total of 60 patients completed the study according to the protocol. Forty-one patients were classified into one of three retrospective groups depending on post-SAB hypotension: mild (15 patients), moderate (9 patients), or severe (17 patients). Two patients were included in the severe group because they required more than two vasopressor boluses to restore SBP. A total of 19 women were studied prospectively: 10 patients were assigned to the low-LF/HF group, and 9 patients were assigned to the high-LF/HF group. Patients of the retrospective as well as the prospective groups were comparable with respect to demographic data (age, weight, height, American Society of Anesthesiologists physical status), blood loss, and level of sensory block (table 1). Apgar levels at 1, 5, and 10 min after delivery, as well as umbilical pH and infant height and weight, were also comparable between groups (table 2).
