|
Nuclear quadrupole resonance for explosive detection Hideo Itozaki and Go Ota
Source link: http://www.s2is.org/Issues/v1/n3/papers/paper8.pdf (full text) Translated to russian: Ishchenko A.A. Abstract- A Nuclear quadrupole resonance detector has been developed. This detector targets to RDX, a high explosive inside an anti-personnel landmine, buried up to 15 cm deep. This detector works well outside an electromagnetically shielded room. It was also mounted an anti-mine vehicle and remotely controlled mine detection is demonstrated in public. Index terms: nuclear quadrupole resonance, NQR, RDX, detector, landmine detection.
I. INTRODUCTION Nuclear quadrupole resonance (NQR) is one of a distinguished candidate for a landmine detection technique. A widely used metal detector is suffered from high false alarm rate because it is required to detect just 10 grams of metallic object in a landmine. Highly sensitive metal detector as this gives an alarm every time it encounters few grams of metal trash, which results in a bad performance. On the contrary, An NQR detector identifies an explosive inside a landmine by a resonant frequency unique to each material. The technique will help to take only a bulk of explosive from metal fragments. NQR landmine detector has been developed all over the world [1-3] to detect 14N spins of an explosive material in a landmine, but very limited paper have been published about the NQR remote detection of explosive in a landmine. This work reports the development of a prototype NQR mine detector and test result of its detectability.
II. EXPLOSIVE DETECTION BY NQR NQR is a kind of interaction between radio frequency (RF) wave and nuclear spins. A schematic view of NQR detection is shown in Fig. 1.
Fig. 1 Schematic view of NQR detection. 14N spin inside a landmine explosive is excited by RF wave, and then emits NQR signal.
When RF wave with a specific frequency is irradiated, the wave is adsorbed by the nuclear spins and then re-emitted after the irradiation. Equation (1) shows the NQR Hamiltonian of 14N, which is the resonant spin in NQR landmine detection [4].
Q is the nuclear quadrupole coupling constant of the resonant spin. Ix, Iy , and Iz are the spin operator and Vxx, Vyy and Vzz are the electric field gradients around the spin to each directions. Since the electric field gradient is unique to each molecule structure, NQR frequency is also unique to each molecule. Fig. 2 shows the NQR frequencies of major explosives, RDX (cyclo–trimethylenetrinitramine), HMX(cyclo-tetramethylenetetranitramine), and TNT (trinitrotoluene). The difference of the frequencies allows identifying explosive material. Fig. 3 shows one of NQR signals from 300 g of RDX (fig.3 (a)) and 300 g of TNT (fig. 3 (b)). Both are detected in an electrically shielded room. 1,000 data were averaged to improve the signal to noise ratio. Measurement pulse sequences are the strong off-resonance comb (SORC) for RDX and the spin locking spin echo (SLSE) for TNT, respectively.
Fig. 2 NQR frequencies of major explosives
Fig. 3 NQR signals of 300 g of explosives. 1,000 signals were averaged. The signals were measured in an electromagnetically shielded room.(a) RDX, and (b) TNT
The measurement times were 2 second for RDX and 200 second for TNT. This is due to the difference of the relaxation time of each material. There are two types of relaxation time in NQR. The one is the longitude relaxation, by which the excited spins are relaxed to the equilibrium state with the spin-lattice relaxation. This time constant of the spin-lattice relaxation is written as T1. T1 dominates the interval time between the sequences, i.e., long T1 drastically decreases the efficiency of NQR measurement. The other is the transverse relaxation, by which the coherently excited spins are randomized by the spin-spin interaction and the thermal scattering, resulting in the cancellation of the NQR signal from each spin. The time constant of the transverse relaxation is written as T2*. Generally T2* is shorter than T1. Since NQR signal continues only for T2*, short T2* makes it difficult to detect the signal. Fig. 4 shows the relaxation times of RDX, TNT, HMT (hexamethylenetetramine), and PNT (para- nitrotoluene). HMT and PNT are the raw materials of RDX and TNT, respectively.
Fig. 4 NQR relaxation times of explosives and their raw materials.
As shown in fig. 4, RDX has relatively long T2* and short T1, while TNT has extremely short T2* and long T1. So RDX is easier to detect than TNT. NQR detector for RDX has been firstly developed to evaluate NQR detectability in the field.
III. NQR MINE DETECTION A prototype of an NQR mine detector has been developed by the support from the Japan Science and Technology Agency. The outlook of the developed sensor-head for NQR mine detection is shown in fig. 5. The detector, W570mm*D285 mm*H290mm, consists of a sensor coil, a matching box, and some small electrical circuits such as a pre-amplifier. This sensor-head weighs 10kg, which is prepared to be used by a mine vehicle.
Fig. 5 Prototype NQR mine detector developed with the support from the Japan Science and Technology Agency.
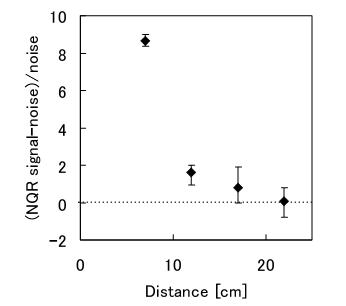
The performance of the developed NQR detector was evaluated. The NQR signal from RDX buried in soil was measured. The sample, 100 g of RDX was packed in a cylindrical plastic case with 110 mm of radius and 80 mm of height. The distance from the bottom of the NQR detector to the top of the sample case was set to 7, 12, and 17cm. The soil moisture was controlled 10%. 220,000 data were averaged at maximum to evaluate the relationship of the measurement time and the signal to noise ratio (SNR). The developed system is capable to acquire 17,000 data in a minute. The measurement was repeated 7 times every one experimental condition. One of the NQR signal obtained by 7 cm detection and background noise were shown in fig.6. The NQR signal was clearly detected in fig. 6(a). Since the NQR signal certainly appears at a steady frequency, the signal intensity was evaluated by the output at that frequency. The dependence of NQR signal intensity on the sample depth was then measured and evaluated. The environmental noise data were acquired seven times and the averaged background noise height was calculated in frequency domain. The difference of obtained data and the averaged noise height was normalized by the averaged noise height. The detection result is shown in fig. 7. The square dot of each detection depth shows the average of the seven data, while the error bar shows the maximum and the minimum of the signal intensity. When the square dot is placed higher than zero, the signals were detected significantly. If the minimum is placed higher than zero, the detections were successful enough.
Fig. 6 NQR detection of 100 g of RDX buried 7cm deep in soil with 10% of soil moisture. Signal accumulation time was 13 minutes. (a) The sample existed.(b) Nothing existed.
Fig. 7 NQR detection of 100 g of RDX buried in soil. The result is normalized by the averaged noise height. The square dot of each detection depth shows the average of the seven data, while the error bar shows the maximum and the minimum of the signal intensity. Dashed line shows the averaged. Signal accumulation time was 13 minutes.
As shown in fig. 7, NQR detection from 7 to 17cm deep was apparently successful. Especially the sample buried 7 or 12 cm deep seems to be clearly detected. 20 cm detection was, however, almost similar as random determination. This drastic decrease of sensitivity may be due to both of the signal diffusion and the decrease of the excitation field by the increase of the detection depth. The latter may be improved by the arrangement of an antenna design and a system innovation, which will result in the sensitivity improvement of 17 or 22 cm detection.
IV. DEMOSTRATION OF NQR MINE DETECTION The NQR detector was mounted on a mine vehicle developed by Hirose Lab. in Tokyo Institute of Technology [5]. This vehicle can be remotely controlled for the safety of a deminer. Fig. 10 shows the outlook. The detectability was demonstrated in public in September and December ’07. The integrated mine detection system was so stable that it detected the NQR signal from 100 g of RDX in 1 minute during the demonstration period.
Fig. 10 NQR detector mounted on a mine vehicle developed by Hirose Lab. in Tokyo Institute of Technology [5].
VI. CONCLUSION An NQR mine detector was reported. The detector detected as small as 100 g of RDX buried up to 12cm perfectly. The performance evaluation by the ROC curve shows that 17 cm is the limitation of the detection depth for 100 g of RDX. The NQR landmine detection was demonstrated in public, in which the detector worked very well. These results clearly show the possibility of NQR mine detection. The reduction of the measurement time and extension of detection depth will remain to be realized.
REFERENCES 1. R. A. Marino, “Detection and identification of explosives by nitrogen-14 NQR,” Proc. New Concepts Sym. Workshop on Detection and Identification of Explosives, Quantico, VA , pp. 399, 1978. 2. V. S. Grechishkin and N. Y. Sinyavskii, “New technologies: nuclear quadrupole resonance as an explosive and narcotic detection technique,” Phys. Usp., vol. 40, pp. 393-406, 1997. 3. A. N. Garroway, M. L. Buess, J. B. Miller, B. H. Suits, A. D. Hibbs, G. A. Barrall, R. Matthews, and L. J. Burnett, “Remote sensing by nuclear quadrupole resonance,” IEEE Trans. Geosci. Remote Sens., vol. 39, pp. 1108-1118, January 2001. 4. J. A. S. Smith, “Nuclear quadrupole resonance spectroscopy,” J. Chem. Edu., vol. 48, pp. 39-49, 1971. 5. M. Freese, E. F. Fukushima, S. Hirose and W. Singhose,” Endpoint vibration control of a mobile mine-detecting robotic manipulator,” Proc. 2007 American Control Conf., pp. 6-12, July 2007.
|

 .
(1)
.
(1)