Computer Science Department,Tsinghua University,100084, Beijing, China
Genetic algorithm is a method of searching, search for a result equal to or close to the answer of a given problem. In the principle of artificial intelligence, the problem of training a generative mode given a set of data (sometimes called parameter estimation) is a typical searching problem -- search for parameters to adjust the model that generates data the most likely to the given training data. Many solutions have been given for different models. In this note, we show how to estimate parameters of a mixture distribution with example and experiments.
It is called optimization that search for answers that best fit some requirements. There are many solutions to different types of optimization problems, such as conjugate gradient method, primal-dual method, simplex method and many many others. A typical subset of the optimization problems is estimating parameters of a generative model given a set of data generated form the model. A Generative model is usually some statistical model that approximate certain data generation procedure (that is why it is called generative). Some parameters adjusts gritty details of the data generation process. The parameter estimation (or model training in AI term) is (1) given a set of data O generated from the model with parameters Qo, (2) to find parameters Qi that most close to Qo, since we lost the Qo or do not know it at all. A famous method for estimate model parameters given a set of partial data or noisy data is maximization expectation algorithm(EM). A fact worthy noticing is: in many problems, why the data is partial is not because it is really partial, but because we try to model it as partial, so EM can be applied. From another aspect, if we model the finite set of parameters as a chromosome string, i.e. each parameter corresponding to a gene in the chromosome. Usually, when the genes are discrete values, like integers, we can find the optimize result with genetic algorithm(GA); when the genes are continuous values, we can find result close to the real value.
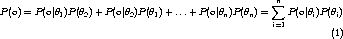
In this section, we demonstrate using genetic algorithm for estimating parameters of a 2-component mixture Gaussian distribution. A mixture distribution with n components is,
Which means, for a given observed sample O, it might be drawn from the th component P(O|Qi) with probability of P(Qi). The probability of observing O is the summation of possibility from all the possible components.
The steps of our experiment contains:
1. Select a model,
2. Draw samples O from the model with parameters of Qo,
3. Now, we forget Qo, and try to find a Qi that best explain the drawn samples O. In some cases, such Qi might close to Qo, but this is not usually true.
In our experiment, the each component is 1D Gaussian, i.e.

In order to give an intuitive visualization of the problem domain in 3D space, we reduce the number of parameter to 2 by


Thus, our mixture distribution can be written as

As you see, there are only 2 parameter, m1 and m2 left.
Now we fix q to 0.3, m1 to 1, and m2 to -1 . We draw 3 samples from the first components, and 3 from the second. The mixture distribution and the drawn samples are shown in figure 1.
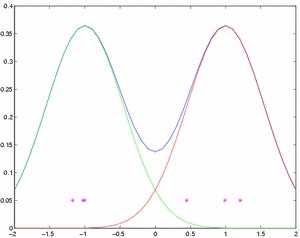
Figure 1 - Our simplified mixture distribution model and 6 samples
With the model type (not the parameters) known, we can compute the likelihood between the samples O={o1,o2,...,o6} and a given parameter set {Q1,Q2}. Since each qi might be generated from either of the 2 components, so the component correspondence of the 6-tuple o, denoted as Q={Q1,Q2,...,Q6}, has 64 possible combinatorial values, denoted as x. The computation of likelihood is as by considering the 6 generations are i.i.d., and the components are independent to each other,

A brute force solution to our problem is to enumerate all possible parameter-pairs {Q1,Q2}. Unfortunately this method is impractical, because the range of Q is infinite.But it can be used to visualize the solution domain, as in figure 2.
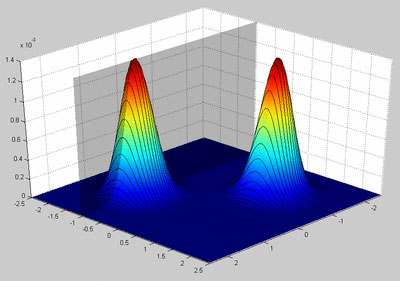
Figure 2 - Visualization of likelihood between all possible parameter pairs and the 6 drawn samples
There are two points in this figure need to be noticed,
From figure 2, it is clear that want we want is the position of one of the two peaks. If we solve this problem with other methods, such like EM algorithm, we will start from one position, and close to the peak with each iteration. With GA, we start from a population of starting positions -- each individual in the population is represented with its chromosome -- a string of genes. In our example, a chromosome is consist of two genes, one for Q1 and the other for Q2. Within each iteration, a fitness value is calculated for each individual in the population. In our example, we choose the likelihood value shown in figure 2 at the fitness value, and then genetic operations are applied to the current population:
1. Elitism elites (with higher likelihood to the 6 drawn samples O) are survived - copied to the population of the next generation,
2. Mate some ratio of individual reproduce offspring by averaging the parents values,
3. Mutate the children mutate by add a random number to the Q1 and/or Q2 value.
Figure 3 shows the likelihood figure together with result of each iteration of our GA algorithm. The red line segments shows the process of close to one of the peaks.
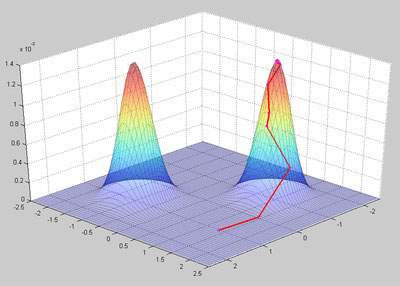
Figure 3 - Result of our GA algorithm