THE EFFECT OF PRE-SERVICE TURBINE BLADE SURFACE ROUGHNESS ON THE FORMATION OF DEPOSITS
John Pettitt, Jeffrey P. Bons
Source of information: http://orca.byu.edu/Reports/Journals/2004%20Final%20reports/ET/Pettitt,%20John%20Frank.doc

|
Land based Gas Turbine (GT) engines are used very widely in power generation plants. The performance of the turbine blades greatly influences the engine’s overall efficiency and service life. As turbine engines operate, the life and performance of the blades are degraded by the deposition of material. Deposits can come from dirty fuels or eroded components or from airborne particles in the environment. Filters have been created for GT engines in an effort to screen out such particles. When particles are ingested into the GT engine and infiltrate these filters they become molten and stick to the turbine blade surfaces. As these deposits build up they increase the aerodynamic drag and raise the temperature of the blades.
The study of this deposited material on turbine blades is complicated by the fact that it takes thousands of hours for the deposits to be formed. Current research being performed by Jensen et. Al has established a suitable facility to accelerate and simulate deposit formation on smaller samples of turbine blade material. This facility simulates the conditions experienced by the turbine blade section of the GT engine, by matching the flow conditions and the concentration of airborne particles. Using this facility, our research focuses on determining whether the initial surface finish of the turbine blade influences deposit formation.
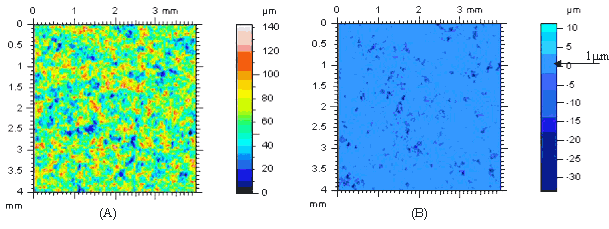
Scientists and engineers have already created many surface parameters in an effort to discover correlations, which accurately predict drag and heat transfer. These parameters include average surface roughness (Ra), mean peak-to-valley height (Rz), Rk parameters, and a host of others. In order to make these types of calculations we used a Hommel Inc. T800 surface measurement system to generate 3-D topography maps of the samples before and after deposition. A very smooth sample (Ra = 0.8) and an unpolished sample (Ra = 12) were both submitted to the deposition process. Surface maps of these samples before deposition are shown in Picture 1.
 |
Picture 1 – Map (A) comes from the rough sample and Map (B) comes from the smooth sample.
The 3-D renderings of these surfaces were too large for this publication. |
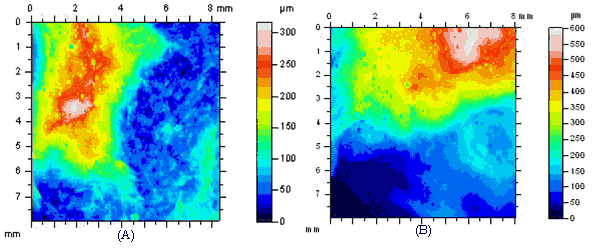
During the deposition process the samples are exposed to a 1200 oC, 450 mph jet mixture of air and molten particles with a concentration of about 150 parts per million by weight for a period of 4 hours. This jet impinges on the surface of the samples at an angle of 30o. Again, these conditions are created to simulate a turbine blade surface in the operating environment of a GT engine. After the deposition process, the samples cool down and much of the built up deposit cracks and falls off. That which remains is more permanent and is the subject of this study. Surface maps of these two samples after deposition are shown in Picture 2.
Picture 2 – Map A is the largest feature on the rough sample. Map B shows the largest feature on the smooth sample. |
The smooth sample had a much greater portion of its surface, which did not appear to have permanent deposit. Though the smooth sample has a smaller surface area of deposit, the areas with deposit are very thick. Yet curiously, the rough sample’s largest features were half the size of the largest features on the smooth sample. These kinds of differences can have a great effect on the drag and heat transfer of turbine blades.
In addition to these maps and parameters we also use the deposit’s chemical composition to characterize the differences between samples. In order to determine these characteristics of the deposit, the samples need to be sectioned and prepared for the Scanning Electron Microscope (SEM). These samples could not be sectioned and prepared for the SEM in time for this publication. After these SEM pictures are obtained, it is a simple matter to measure the deposits thickness from the datum of the TBC with error of less than 10%. Furthermore, in order to determine the chemical composition of the deposit, X-Ray spectroscopy is used to analyze any portion of the digital pictures taken by the SEM. Preparing the samples for the SEM and X-Ray Spectroscopy is much more time intensive than taking the pictures and finding the chemical composition.
From the preliminary information, it is appears that surface finish significantly alters the structure of deposits. Given further study, more statistically strong conclusions could be made as to the actual nature of the deposits (i.e. their chemical composition) and the relative design tradeoffs which should be considered in relation to the polishing of turbine blades.

|

|


