DETECTION OF OVERSIZED MATERIAL IN A HYDROTRANSPORT SLURRY PIPE USING A NON-INVASIVE ACOUSTIC METHOD
Katherine Albion, Joseph Downey, Erin Hansuld, Derek Hartling, Lauren Briens, Cedric Briens, Franco Berruti, Steven McDougall*
Western Fluidization Group, Faculty of Engineering
The University of Western Ontario, London, Ontario, N6A 5B9, Canada
*Syncrude Canada Ltd., Research Centre, Edmonton, Alberta, T6H 1H4, Canada
ABSTRACT
Large material, such as rocks, in a hydrotransport system of fine particles can damage pumps and equipment. A reliable, non-intrusive, and on-line acoustic method was developed for the detection of this large material. Analysis of signals recorded by microphones attached to the pipe wall allows for the reliable detection of rocks of different sizes and shapes, with no false positives.
INTRODUCTION
In the hydrotransport of oil sand, it is not uncommon to have rocks in the mined ore (1). Although rocks can be removed from the sand using screens before the oil sand is slurried, screen wear leads to holes which allow rocks and metal pieces from shovels, to enter the pipeline. This oversized material can become lodged in pump impellers resulting in damage to the pump, downtime and loss of production.
The objective of this paper is to present a detection method for oversized material in a hydrotransport system. Only non-invasive sensors were used since abrasive conditions in the pipe would damage invasive probes. External microphones were selected as the non-invasive sensors and their signals were analysed using advanced methods.
BACKGROUND INFORMATION
Oil sand Mining and Extraction
In the current hydrotransport process, trucks from the mine deliver the oil sand to crushers that use a double roll crusher (2). The crushed oil sand is sent to a feeder, where it is mixed with caustic soda and hot water and pumped to the extraction facility through a hydrotransport pipe using booster pump houses. Once in the extraction facility, the oil sand is sent to tumblers where caustic soda, hot water and steam are mixed, and the mixture is aerated. The slurry is then discharged to vibrating screens to remove solid materials (3).
Hydrotransport is the process of combining oil sand and hot water to create a slurry that is pumped through the pipeline. Most of the slurry passes through a vibrating screen that is inclined to allow oversized material to slide down the screen. Large remaining material is discarded as waste or recrushed and processed (1). In hydrotransport, most large particles are oil sand lumps which would ablate during transport. However, some of the oversized material can be oil free hard rocks or undigested ore (2).
Rock Motion
Wu et al. (4) state that particle motion in the hydrotransport line occurs through rolling, sliding, lifting or bouncing. Properties that influence particle transport include turbulent flow fluctuations, heterogeneous particle sizes, shapes and densities. Drake et al. (5) determined that for small particles, entrainment was through rolling and lift-off. Entrainment of large particles was caused by rolling of large particles and sliding of angular particles, with some entrainment caused by particle-particle impacts. It was determined that regardless of the motion mechanism, larger particles travelled 30% slower than the smaller particles.
Acoustics
Acoustic sensors are inexpensive and can withstand a wide range of process conditions. They provide reliable, on-line and non-intrusive monitoring. There are two acoustic monitoring methods:
- active acoustics detect the effect of the process on a transmitted ultrasonic acoustic wave; and
- passive acoustics detect the acoustic emissions generated by the process.
In processes involving the movement of solid particles, acoustic emissions are caused by particles colliding with each other, vessel walls or other objects (6). Generally, passive acoustic methods are much easier to implement and are preferred when the process acoustic emissions are strong, as is the case with rocks in hydrotransport systems.
Kurtosis, which is a measure of the relative peakedness of a distribution, has been used for the signal analysis. It is a dimensionless value used to determine the relative height of a peak (7).
In addition, multiple regression has been used to determine the relationship between independent variables and a dependent variable, and to identify the main contributing variables that predict this relationship. The F-statistic has been utilized to indicate how well the data fit the estimated parameters (8).
EQUIPMENT AND EXPERIMENTAL METHODS
Hydrotransport System
The hydrotransport system utilized in this study consisted of a 0.05 m inside diameter stainless steel pipe, shown in Figure 1. Water and solids were initially added to the storage tank through an opening at the top of the vessel. A diaphragm pump was used to pump the slurry through the pipeline. A magnetic flux flowmeter was used to set and monitor the slurry velocity. After exiting the diaphragm pump, the slurry flowed down an inclined pipe section, with a length of 2.75 m at an angle of 30o from the horizontal. The slurry then travelled through a 1.7 m, upward vertical section and a 3.6 m horizontal section before returning to the storage tank. A rock injection chamber was located at the top of the inclined line. This chamber consisted of two ball valves, which acted as a water lock and allowed for the introduction of rocks under running conditions. A rock cage was located on the end of the pipe, inside the storage tank, to prevent rocks from re-entering the system and damaging the pump. Ball valves below the storage tank allowed for drainage of the slurry from the tank and pipeline.
Slurry and Rock Characteristics
Silica sand was used to develop the rock detection method at various slurry concentrations and velocities. The Sauter-mean diameter of the silica sand was 180 µm and its particle density was 2 650 kg/m3. The terminal velocity of a single sand particle with that Sauter-mean diameter was calculated to be 0.022 m/s. The slurry concentration was controlled by the amount of silica sand added to the storage vessel. The slurry velocities examined were 1, 2, 3 and 3.5 m/s, with slurry concentrations of 10, 20, 30, 40 and 50 weight%.
Thirteen rocks were used to test the detection method over a range of particles sizes, shapes and densities. The rocks are shown in Figure 2.
Acoustic Sensors
Ten acoustic sensors were located directly on the side of the pipe, at each measurement location. Measurement locations were evenly spaced along the pipe at 0.05, 0.90, 1.80 and 2.75 m in the inclined section, and at 0.03, 0.50, 1.00, 1.50, 2.00 and 2.50 m in the horizontal section measured from the vertical to horizontal elbow. The microphone locations are shown in Figure 1. The acoustic sensors were secured to the pipeline using a shim shaped to the form of the sensor, and attached to a thin foam base. This base was held tightly in contact with the pipe with Velcro wrapped around the pipe circumference.
Experimental Method
For each slurry concentration, 45 litres of water and the appropriate amount of sand were added to the tank, and the desired slurry flowrate was set. After the flow stabilized, the acoustic measurements were started. One rock was added to the slurry during each acoustic measurement. The rock travelled through the system and was caught in the rock cage at the end of the pipe in the storage tank. To recover the rocks, the rock cage was unscrewed off of the pipe, emptied and replaced.
Signal Analysis Methods
Raw signals were recorded using National Instruments’ Labview data acquisition software. Kurtosis of the signal was calculated; the amplitude of peaks in the raw signal correspond to the magnitude of the peaks of kurtosis. The time interval length to calculate kurtosis was 0.010 s. A kurtosis threshold limit was set using a limit of 10 V4. The number of peaks in the signal was calculated based on the number of peaks above this threshold value. This value was chosen since it could distinguish between peaks caused by slurry noise and the rock collisions with the wall.
RESULTS AND DISCUSSION
Raw Acoustic Signals
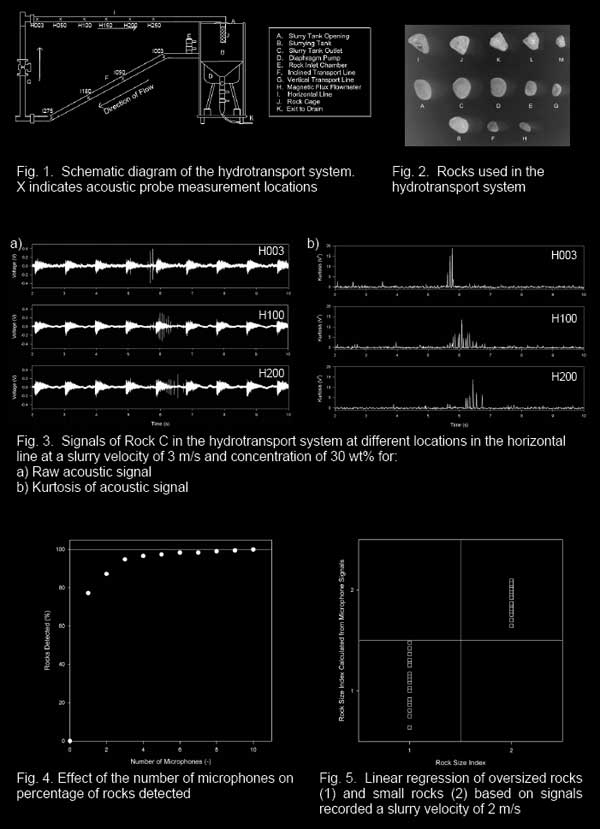
Figure 3a shows the raw acoustic signals at different locations along the horizontal hydrotransport pipe corresponding to measurements recorded at 0.03, 1.00 and 2.00 m respectively in the horizontal line. The rock utilized in this experiment was Rock C, which is a larger sized rounded rock (Figure 2), at a slurry velocity of 3.0 m/s and a concentration of 30 wt%.
As shown by the signals in Figure 3a, regular pulses exist in the signal, which correspond to the pulsations created by the diaphragm pump at approximately 0.5 s intervals. The pulses in this acoustic signal were caused by the movement of the slurry each time the pump pumped.
A series of additional, much narrower peaks occurred at all microphone locations between approximately 5.5-6.5 s. These peaks indicate the passage of a rock through the pipe. Peaks in the acoustic signal are a function of the rock size and of the distance from the point of impact and the microphone. On the average, larger rocks and impacts closer to the location of the microphone were found to result in larger peaks, whereas smaller rocks and impacts further from the microphone location caused smaller peaks. However, a small rock hitting the wall near the microphone caused a larger peak than a large rock hitting the wall far from the microphone: the peak size decreased with increasing distance from the microphone.
The progression of the rock can be seen in the raw signal. In Figure 3a, the rock is at 0.03 m at approximately 5.5 s, and by 6.5 s, it has moved to 2.00 m from the elbow. It was found that at higher slurry velocities, rocks have a shorter residence time in the pipe than at lower slurry velocities, where it took the rocks a longer time to travel through the pipe. It was found that at a slurry velocity of 1 m/s, and concentrations of 10, 20 and 30 wt%, all the rocks would momentarily deposit at the bottom of the inclined pipe and then move on. However, at 1 m/s and concentrations of 40 wt% and 50 wt%, the rocks always travelled through the system. The enhanced motion of the rocks was attributed to the increase in the effective slurry viscosity at higher concentrations of sand. Rocks were detected by the microphones in all cases.
Kurtosis of the Raw Acoustic Signal
Figure 3b shows that the kurtosis peaks correspond to the peaks observed in Figure 3a, between approximately 5.5-6.5 s. Again, Figure 3b corresponds to the acoustic probes at 0.03, 1.00 and 2.00 m in the horizontal line. The kurtosis peaks were calculated over a time interval of 0.010 s.
Comparing the signals in Figure 3a with the signals in Figure 3b, the occurrence of the peaks is the same, and the magnitude of the peaks are similar: bigger peaks in the raw signal correspond to larger peaks of the calculated kurtosis. Again, bigger peaks correspond to rock collisions with the wall closer to the microphone location.
There is generally a large peak with smaller peaks on either side which indicate that the microphone recorded signals from the rock as it approached and travelled away from the microphone location.
While a comparison of Figures 3a and 3b show that the same peaks corresponding to the stone impacts were detected, they are much clearer in Figure 3b than in Figure 3a. It is to be noted that the pulses in the signal caused by the pump are not present in the calculated kurtosis signal. The rock can be detected using kurtosis even if sound from the rock cannot be distinguished from the pump noise in the raw acoustic signal. This makes the calculation of kurtosis using acoustic probes a valuable tool to detect the presence of a rock in the hydrotransport system. All the rocks in the system were detected using kurtosis of the raw signal from the 10 microphones, and there were no false warnings of rocks when there were no rocks in the system.
Effect of the Number of Microphones and Critical Microphone Locations
Figure 4 shows the effect of the number of microphones on the percentage of rocks detected by the microphones. The number of collisions that were detected at each microphone location was calculated, and, for each number of microphones, the best combination of microphones was used. Figure 4 shows that 10 microphones are required for detection of all the rocks, and that decreasing the number of microphones decreases the effectiveness of the detection method, particularly when only one or two microphones are used. It was determined that the microphone at 0.03 m in the horizontal section (Figure 1) is the most critical microphone in the system, since it detected the most collisions.
Determining Rock Size with the Microphones
Different rock properties were considered to describe the rock behaviour. The volume-equivalent diameter of the rocks was found to correlate well with the number of collisions.
The number of rock-wall collisions was greatly affected by the slurry velocity; increasing the slurry velocity decreases the number of rock-wall collisions. Large rocks result in more collisions than small rocks, presumably because it is harder to keep them in suspension. Due to gravity, larger rocks fall out of suspension more frequently, leading to more collisions with the wall. At high slurry velocities, the slurry is better at maintaining a rock in suspension, resulting in fewer impacts with the wall. The larger rocks are heavier and are harder to keep in suspension than the smaller, lighter rocks.
In hydrotransport of oil sand, large rocks are especially undesirable since they can be potentially more damaging. However it is impossible to avoid having rocks in the system. It is important to determine a size of rock that is oversized and would cause immediate damage to equipment and pumps in the system, and what rock size can be tolerated without causing damage. In this case, an acceptable rock size was assumed to correspond a rock diameter/pipe diameter of less than 25% of the pipe diameter: a rock with a diameter greater than 25% of the pipe diameter would be deemed unacceptable. A rock size index of 1 was assigned to rocks with a rock diameter/pipe diameter ratio greater than 25%, and an index of 2 for rocks with the diameter ratio less than 25%.
To determine whether the microphone signals could be used to monitor the hydrotransport system and determine the rock size, regression was used to correlate the rock size index to the total number of collisions from the 10 acoustic probes determined through kurtosis. A kurtosis threshold limit of 10 V4 was chosen to distinguish a rock collision from slurry noise. A kurtosis value greater than the threshold indicated a collision had occurred.
Since it was determined that the slurry velocity affected the number of collisions, regression was performed on the number of collisions for all rocks and all concentrations at each velocity. A single regression cannot determine the rock size for all slurry velocities, since a large rock at a high slurry velocity can have the same number of collisions as a small rock at a low slurry velocity. However, at each velocity, the number of collisions is always greater for larger rocks than for smaller rocks.
Figure 5 shows that microphone signals can be used to reliably determine the rock size. Figure 5 shows results obtained with the linear relationship calculated by regression for rocks at a slurry velocity of 2 m/s. The actual equations to determine the size index of the rocks at slurry velocities of 2, 3 and 3.5 m/s are:
- 2 m/s: S = 2.10 – 0.0859nTC (1)
- 3 m/s: S = 2.04 – 0.111nTC (2)
- 3.5 m/s: S = 2.20 – 0.0559nTC (3)
where S is the calculated rock size index and nTC is the total number of collisions between the rock and the pipe wall as it is transported through the system.
It was found that for regression to work, the total number of collisions from the 10 microphones was required to determine the rock size. Reducing the number of microphones was found to provide inaccurate rock size estimates.
CONCLUSIONS
Acoustic probes at regularly spaced intervals on the hydrotransport pipe can be used to detect rocks and oversized material within the pipe. Testing with a variety of rocks of different sizes, shapes and densities showed that the detection method worked for any rock. Using kurtosis, all rocks were detected in the system at all slurry velocities, and there were no false indications of rockswhen there were none in the line. As well, the kurtosis of the acoustic signals can be used to determine the rock size for use as a warning if a rock in the pipe is oversized which can lead to equipment damage and downtime.
Increasing the slurry velocity was found to decrease the number of collisions between the rocks and the pipe wall. At low velocities, the rocks are not suspended by the slurry, and experience many collisions with the pipe wall. At high velocities, the rocks are in suspension for longer periods of time, travelling longer distances before impacting the pipe. Larger rocks experience more collisions than smaller rocks due to their larger terminal velocity and the difficulty keeping them in suspension.
It is recommended that an array of microphones be used for rock detection and for the estimation of the rock size. In the current microphone configuration, a rock is detected best at the 0.03 m after the elbow, with the most collisions between rocks and the pipe wall occurring after the elbow in the horizontal section of the pipe. However, with ten microphones the method becomes perfectly reliable: any rock is always detected, with no false warnings.
ACKNOWLEDGEMENTS
The authors would like to thank the National Sciences and Engineering Research Council of Canada and Syncrude Canada Ltd. for their financial support of this research. The authors would also like to thank Mike Gaylard and Souheil Afara at the University of Western Ontario,
NOTATION
nTC Total number of rock collisions with the wall (-)
S Calculated rock size index (-)
MAIN RESULTS
REFERENCES
- Paine, R.B.; and Wright, B.M., CIM Bulletin, 92, 105-108 (1999).
- Sanders, R.S.; Schaan, J.; Hughes, R.; and Shook, C., Can. J. Chem. Eng., 82,850-857 (2004).
- Valenti, M., Mechanical Engineering Magazine,
http://www.memagazine.org/backissues/december98/features/oilsand/oilsand.ht ml, (1998). - Wu, F.-C.; and Chou, Y.-J., J. Hydraul. Div., Am. Soc. Civ. Eng., 129, 110-119 (2003).
- Drake, T.G.; Shreve, R.L.; Dietrich, W.E.; Whiting, P.J.; and Leopold, L.B., J.Fluid Mech., 192, 193-217 (1988).
- Boyd, J.W.R.; and Varley, J., Chem. Eng. Sci., 56, 1749-1767 (2001).
- Flott, L.W., Metal Finishing, 93, 52-55 (1995).
- Wu, C.F.J.; Holt, D.; and Holmes, D.J., Journal of the American Statistical Association, 83, 150-159 (1988).