Publisher: Springer Netherlands
Issue: Volume 7, Number 1 / December, 1955
Pages: 115-122
An approximation method in numerical
computation of the Leontief's open input-output model
Introduction
In the Leontief's open input-output model, the numerical value in each industry associated with a given amount of final demand is usually computed by means of the inverse matrix 9 It, however, is not a easy job to obtain the inverse of given matrix. Concerning this, it seems to have been considered as necessary to use a large scale computer when the number of industries is large. In this article we shall give simple ways to compute approximate values, in which use is made only of a table-computer.
Methods of approximation
Let Yi, denote the given, amount of final demand in the i-th industry, Xi that of out-put to be obtained in the i-th industry associated with these final demands Yi's and aij technical coefficients 9 Then the Leontief's system of linear equations is written as follows:
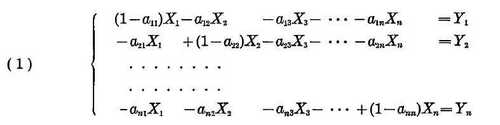
These linear equations can also be written as

where bii=1-aii
If the amounts of the final demands and those of outputs used in calculating these technical coefficients aij are represented by Yi' and Xi' these values must also satisfy the following equations.

Then we put Xi(1)

which is taken as an approximation to Xi. These values can be easily calculated, for Yi' и Xi' are known and Yi are given.
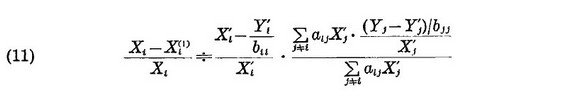
For the purpose of getting a better approximation, we estimate the error of that approximation. From (3) and (4), we obtain

The relative error of the approximation of Xi is then represented as
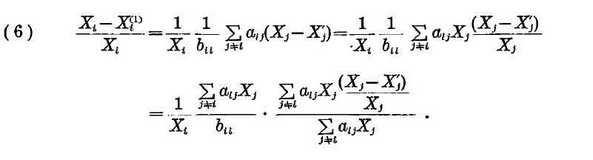
Since

from (6) and (7), we have

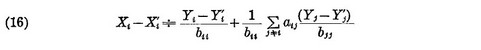
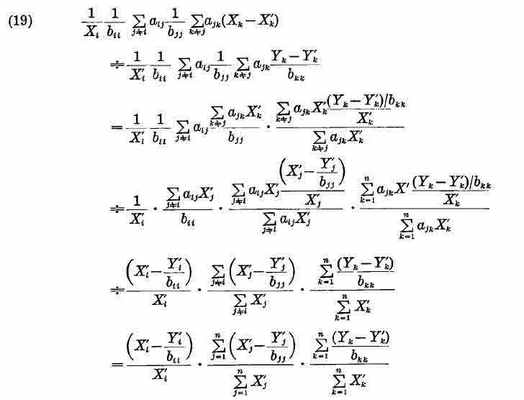
Subtracting (3) from (2) side by side, we get
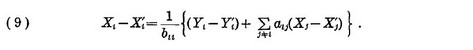
From (9) and (8) it follows that
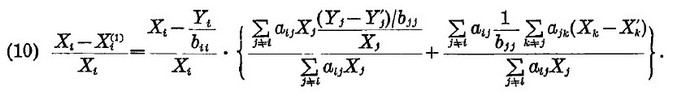
As Xi are unknown, we estimate these values by replacing Yi Xi by Yi' Xi'and by neglecting the second term in the braces of (10), that is, we estimate the values from
Now, aijXj' is the input of the i-th industry into the j-th industry, and may be positively correlated with Xi' for fixed i. Therefore, replacing aijXj' by Xj', we have
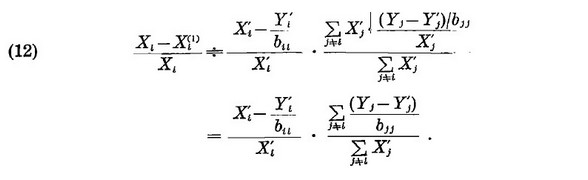
Using these values, we obtain a better approximation of Xi
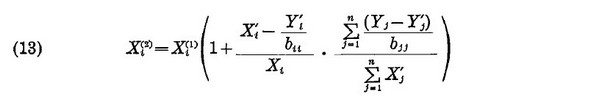
If 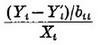 has an extra-ordinary value for large Xi' we should use
 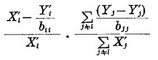 for the second term in the parchtheses of (13) intead of
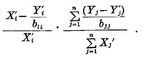
From the equations (2) and (3) we have

Subtracting (15) from (14) side by side and neglecting the third term, we have
The second term of the right hand side of (16) can be estimated in the similar way as in obtaining (12), that is,
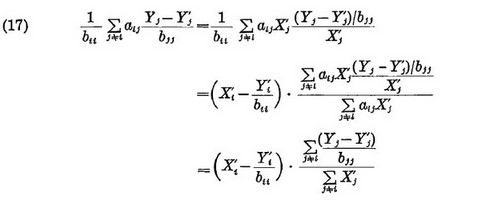
Then substituting (17) into (16), we get an approximation Xi(3) of Xi

Errors and remark
The relative error of the approximation Xi(1), is of nearly the same as the value of the second term of the approximation Xi(1). For the short term forecasting, even that approximation may be satisfactory.
For the long range forecasting it is better to use the approximation Xi(2) or Xi(3). In these two approximations, the second term multiplier of Xi(1) in Xi(2) and that of Xi' in Xi(3) are of the same.
For the evaluation of this error, we estimate the difference between weights dij by the difference between  and
and
 for such a j that
 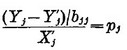 has an extraordinary value. .
It can be seen that 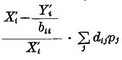 may give the rough estimate of the error in consideration.
Next, we estimate the neglected term by the formula
From two values estimated above, the roughly estimated error can be obtained for Xi(2) and Xi(3). hen this relative error is negative, we use Xi(2). When it is positive, we use Xi(3)
When some of technical coefficients are changed from those obtained from the survey by taking into account technological change, we should use the values of the final demands computed from the changed technical coefficients and the output data of the survey. These values of the final demands can easily be computed.
If a further better approximation is wanted, we can get it by the successive approximation method, in which Xi(2) or Xi(3)is to be used the first approximation. In this case, stratifying Xi',we can use in place of each Xi' the mean of the stratum in which Xi'lies. In this way the computation is made much simpler.
Example
This table of technical coefficients is concerned with the Japan Economy in 1951 and is presented by Japan Economic Council Board. Xi in 1952 are forecast while Yi are given.
Industry
- Agriculture, Forestry and Fisheries
- Mining
- Construction
- Manufacturing
- Whole sale and Retail Trade
- Transportation and Communication
- Public Utilities
- Service
- Unknown.
| 1 | 2 | 3 | 4 | 5 | 6 | 7 | 8 | 9 | |
| 1 | 0.128667 | 0.028314 | 0.017017 | 0.094223 | 0.002212 | 0.004733 | 0. | 0.28374 | 0.073596 |
| 2 | 0.000633 | 0.019320 | 0.027813 | 0.030733 | 0.000466 | 0.043543 | 0.312999 | 0.001587 | 0.007885 |
| 3 | 0.003796 | 0.005330 | 0.005124 | 0.004937 | 0.008963 | 0.017850 | 0.037058 | 0.010360 | 0. |
| 4 | 0.071494 | 0.124251 | 0.436780 | 0.413359 | 0.028635 | 0.151589 | 0.045610 | 0.089322 | 0.210514 |
| 5 | 0.031059 | 0.018654 | 0.043001 | 0.042147 | 0.006053 | 0.013387 | 0.015393 | 0.017547 | 0.030108 |
| 6 | 0.018866 | 0.048301 | 0.067521 | 0.038398 | 0.053661 | 0.037593 | 0.130559 | 0.046108 | 0.226284 |
| 7 | 0.000633 | 0.030646 | 0.000549 | 0.016016 | 0.010825 | 0.008555 | 0.012543 | 0.010267 | 0.014098 |
| 8 | 0.018751 | 0.026649 | 0.029643 | 0.018262 | 0.044695 | 0.077214 | 0.026226 | 0.090069 | 0.236798 |
| 9 | 0.008570 | 0.098268 | 0.068070 | 0.033553 | 0.022349 | 0.011765 | 0.062714 | 0.002240 | 0. |
| Xi' | Yi' | 1/bii | Yi'/bii | Xi'-Yi'/bii | (Xi'-Yi'/bii)/Xi' | Yi | |
| 1 | 17.386 | 9.228 | 1.147667 | 10.591 | 6.795 | 0.39 | 9.926 |
| 2 | 3.002 | 200 | 1.019701 | 204 | 2.798 | 0.93 | 259 |
| 3 | 5.465 | 4.704 | 1.005150 | 4.728 | 737 | 0.16 | 5.119 |
| 4 | 53.883 | 24.322 | 1.704620 | 41.460 | 12.423 | 0.23 | 24.351 |
| 5 | 8.591 | 4.997 | 1.006090 | 5.027 | 3.564 | 0.41 | 5.349 |
| 6 | 7.395 | 2.075 | 1.039061 | 2.502 | 4.893 | 0.66 | 2.408 |
| 7 | 1.754 | 432 | 1.012702 | 437 | 1.317 | 0.75 | 467 |
| 8 | 10.714 | 6.205 | 1.098984 | 6.819 | 3.895 | 0.36 | 7.955 |
| 9 | 4.185 | 1.147 | 1.0 | 1.147 | 3.038 | 0.72 | 657 |
| Всего | 112.375 | 702.915 | 39.460 |
| Yi-Yi' | (Yi-Yi')/bii | ∑(Yi-Yi')/bii))/∑Xj' | |
|
| 1 | 698 | 801 | 0.028 | 0.012 |
| 2 | 59 | 60 | 0.031 | 0.029 |
| 3 | 415 | 417 | 0.031 | 0.005 |
| 4 | 29 | 49 | 0.059 | 0.016 |
| 5 | 352 | 354 | 0.031 | 0.017 |
| 6 | 333 | 346 | 0.031 | 0.020 |
| 7 | 35 | 35 | 0.031 | 0.023 |
| 8 | 1750 | 1923 | 0.17 | 0.006 |
| 9 | - 490 | - 490 | 0.031 | 0.022 |
| Xi1 | Error percent | Xi2 | Error percent | (Xi'-Yi'/bii)*∑(Yi-Yi')/bii))/∑Xj' | |
| 1 | 18.187 | 0.8% | 18.405 | -0.4% | 190 |
| 2 | 3.062 | 2.7 | 3.151 | -0.1 | 88 |
| 3 | 5.882 | 0.8 | 5.911 | 0.3 | 23 |
| 4 | 53.932 | 1.5 | 54.795 | -0.1 | 733 |
| 5 | 8.945 | 1.3 | 9.061 | 0.03 | 110 |
| 6 | 7.741 | 1.7 | 7.896 | -0.3 | 152 |
| 7 | 1.789 | 2.1 | 1.830 | -0.1 | 41 |
| 8 | 12.637 | 0.2 | 2.713 | -0.4 | 66 |
| 9 | 3.695 | 2.9 | 3.776 | 0.8 | 94 |
| Xi3 | Error percent | Xi calculated by means of inverse matrix | |
| 1 | 18.377 | -0.3% | 18.328 |
| 2 | 3.150 | -0.1 | 3.148 |
| 3 | 5.905 | 0.4 | 5.927 |
| 4 | 54.665 | 0.1 | 54.734 |
| 5 | 9.055 | 0.1 | 9.064 |
| 6 | 7.893 | -0.3 | 7.873 |
| 7 | 1.830 | -0.1 | 1.828 |
| 8 | 12.703 | -0.3 | 12.660 |
| 9 | 3.789 | 0.4 | 3.805 |
Publisher: Springer Netherlands
Issue: Volume 7, Number 1 / December, 1955
Pages: 115-122