2. Clustering Algorithms
2.1 K-means
The K-means algorithm, first
introduced in (McQueen, 1967), is an is an unsupervised clustering
algorithm which partitions a data set into a certain number of
clusters. The K- means algorithm is based on the minimization of a
performance index which is defined as the sum of the squared distances
from all points in a cluster domain to the cluster center (Tou &
Gonzalez, 1974). First K random
initial cluster centers are chosen. Then, each sample is assigned to a
cluster based on the minimum distance to the cluster centers. Finally
cluster centers are updated to the average of the values in each
cluster. This is repeated until cluster centers no longer change. Steps
in the K-Means algorithm are:
Step 1: Initialize K initial cluster centers randomly.
Step 2: For each pixel, calculate the
distance to the cluster centers and assign the pixel to a cluster which
has the minimum distance to its center.
Step 3: Calculate the average of the pixel values in each cluster and take them as new cluster centers.
Step 4: Repeat steps 2 and 3 until new cluster centers converge to the previous ones.
The K-means algorithm tends to find
the local minima rather than the global minima. Therefore, it is
heavily influenced by the choice of initial cluster centers and the
distribution of data. Most of the time the results become more
acceptable when initial cluster centers are chosen relatively far apart
since the main clusters in a given data are usually distinguished in
such a way. If the main clusters in a given data are too close to one
another in the feature space, the K-means algorithm fails to recognize
these clusters. For its improvement the K- means algorithm needs to be
enhanced with the optimization technique in order to be less dependent
on a given data set and initial cluster centers.
2.2 Simple Competitive Learning
Competitive learning model introduced
by Rumelhart and Zipser in (Rumelhart & Zipser, 1986) is an
interesting and powerful learning algorithm which can be used in
unsupervised training for image classification (Hung, 1993). Several
different competitive learning algorithms have been proposed by neural
network researchers. These algorithms are capable of detecting various
features represented in input signals. They have been applied in
several different areas such as graph bipartitioning, vector
quantization, etc (Hertz & Krogh, 1991). In this section the
unsupervised simple competitive learning will be briefly presented.
The neural network models are characterized by the topology, activation
function and learning rules. The topology of the simple competitive
learning algorithm can be represented as a one-layered output neural
net. Each input node is connected to each output node. The number of
input nodes is determined by the dimension of the training patterns.
Unlike the output nodes in the Kohonen’s feature map, there is no
particular geometrical relationship between the output nodes in the
simple competitive learning. In the following development, a 2-D
one-layered output neural net will be used. During the process of
training, the input vectors are fed into the network sequentially in
time. The “trained” classes are represented by the output
nodes and the center of each class is stored in the connection weights
between input and output nodes. The following algorithm outlines the
operation of the simple competitive learning as applied to unsupervised
training in (Hung, 1993); Let L denote the dimension of the input vectors, which for us is the number of spectral bands. We assume that a 2-D (N x N) output layer is defined for the algorithm, where N is chosen so that the expected number of the classes is less than or equal to N2.
Step 1: Initialize weights wij(t) (i = 1, …, L and j = 1, …, N x N) to small random values. Steps 2 to 5 are repeated for each pixel in the training data set for each iteration.
Step 2: Present an input pixel X (t) = (x1,…, xL) at time t.
Step 3: Compute the distance dj between xi and each output node using
where i, j, L, wij and xi are similarly defined as in steps 1 and 2.
Step 4: Select an output node j* which has the minimum distance. This node is called the best matching unit (BMU) or the winning node.
Step 5: Update weights of the winning node j* using
where Ʀ(t) is a monotonically slowly decreasing function of t and its value is between 0 and 1.
Step 6: Select a subset of these N2 output nodes as classes.
SCL shows stability over different run
trials but this stable result is not always the global optima. In fact,
in some cases the SCL converges to local optima over all run trials and
the learning rate needs to be adjusted in the course of experimentation
so that the global optimization can be achieved.
3. Swarm Intelligence
There are a number of techniques,
developed for optimization, inspired by the behaviours of natural
systems (Pham & Karaboga, 2000). In this study, we employ swarm
intelligence, a natural optimization technique for optimizing both
K-means and SCL algorithms.
3.1 Ant Colony Optimization
The ACO heuristic is inspired by the
foraging behaviour of a real ant colony in finding the shortest path
between the nest and the food. This is achieved by a deposited and
accumulated chemical substance called pheromone by
the passing ant which moves towards the food. In its searching the ant
uses its own knowledge of where the smell of the food comes from (we
call it as heuristic information) and the other ants’ decision of the path toward the food (pheromone information).
After it decides its own path, it confirms the path by depositing its
own pheromone making the pheromone trail denser and more probable to be
chosen by other ants. This is a learning mechanism ants possess besides
their own recognition of the path. As a result of t this consultation
with the ants’ behaviors already shown in searching for the food
and returning to the nest, the best path which is the shortest is
marked between the location of the nest and the location of the food.
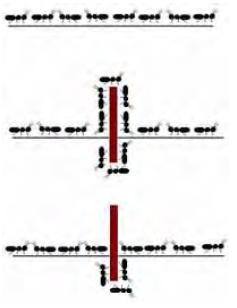
Figure 1. Ants finding the shortest path around an obstacle as a result of pheromone concentration
It was reported in the literature
(Dorigo et al, 1996) that the experiments show when the ants have two
or more fixed paths with the same length available from a nest to the
food, they eventually concentrate on one of the paths and when the
available paths are different in length they often concentrate on the
shortest path. This is shown in Figure 1, when an obstacle is placed on
the established path of ants, they first wander around the obstacle
randomly. The ants going on a shorter path reach the food and return
back to the nest more quickly. After a certain amount of time, the
shorter path will be reinforced by pheromone. This path eventually
becomes the preferred path of the ants (Zheng et al., 2003).
ACO uses this learning mechanism for the optimization. Furthermore, in
the ACO algorithm, the pheromone level is updated based on the best
solution obtained by a number of ants. The pheromone amount that is
deposited by the succeeding ant is defined to be proportional to the
quality of the solution it produces. For the real ants as shown in
Figure 1, the best solution is the shortest path and it is marked with
a strong pheromone trail. In the shortest path problem using the ACO
algorithm, the pheromone amount deposited is inversely proportional to
the length of the path.
In their research, Dorigo et al (1996) took the ant system as a colony
of cooperating agents for solving the traveling salesman problem (TSP).
Considering the short path problem, suppose for any pair of nodes Vi and Vj on the graph G, there is a connection cost attached to the edge (Vi, Vj) and the pheromone trail and heuristic information are stored on the edge.
The goal of an ACO heuristic is then to find the shortest path on graph G. In ACO heuristic, m artificial ants are normally used to find the best solution. Suppose an ant k is in vertex Vi at certain step i during its search process. This ant selects the connection with the probability (Dorigo et al., 1996):
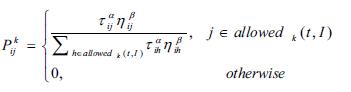
where Pkij is the probability of ant k choosing the path (Vi, Vj) from Vi. Parameters Uij and Ljij are the pheromone and heuristic information assigned to the edge (Vi, Vj) respectively, ǂ and ! are constants that determine the relative influence of the pheromone and heuristic information, and allowedk(t, I) is the set of vertices which is allowed to be visited according to problem constraints.
Then ant k moves and deposits a pheromone on the trail, which is defined below:

where Q is a positive constant and Lk is the cost of the path used by ant k. After all m ants completed their path finding, the pheromone on each edge is updated according to the following formula:
where o is the evaporation factor (0 1)
which causes the earlier pheromones vanish over the iterations.
Therefore, as the solution becomes better, the corresponding pheromone
have more effect on the next solution rather than the earlier
pheromones which correspond to the initial undesired solutions found.
This pheromone information will be a
guide for the new set of ants. Each time, the current best solution is
saved, and this process will be repeated until a termination criterion
is met.
3.2 Particle Swarm Optimization
The PSO algorithm is inspired by the
group behavior of schools of fish, flocks of birds and swarms of
insects. As an example, birds are likely to find food in flocks,
without knowing its location in advance. It seems that members of the
flock buildup their intuition in order to find their nutriment. As
sociobiologist E. O. Wilson (Wilson, 1975) has written, in reference to
fish schooling, “In theory at least, individual members of the
school can profit from the discoveries and previous experience of all
other members of the school during the search for food. This advantage
can become decisive, outweighing the disadvantages of competition for
food items, whenever the resource is unpredictably distributed in
patches.”
The PSO algorithm consists of a swarm
of particles flying through the search space (Kaewkamnerdpong &
Bentley, 2005). Each particle’s position is a potential solution
to the problem. Each particle’s velocity is modified based on its
distance from its personal best position and the global best
position. In other words the particles move according to their
experience and that of their neighbors which yields to the best fitness
value.
The objective function evaluates the positions of the particles. Personal best position (pbest) is then obtained as follows (van der Merwe & Engelbrecht, 2003):
where f is the objective function. The global best position (gbest) is obtained as follows (van der Merwe & Engelbrecht, 2003):
For each iteration of a PSO algorithm, vi and xi are updated as follows (van der Merwe & Engelbrecht, 2003):
where u is
the inertia weight which serves as a memory of previous velocities. The
inertia weight controls the impact of the previous velocity. The
cognitive component, yi(t)–xi represents the particle’s own experience as to where the best solution is. The social component, Ɛ(t) – xi represents the belief of the entire swarm as to where the best solution is. c1 and c2 are acceleration constants and r1(t) , r2(t) ~ U(0,1) ,where U(0,1) is a random number between 0 and 1.
The PSO algorithm is repeated until a
termination criterion is reached or the changes in velocity get near to
zero. A fitness function is used to evaluate the optimality of the
solution. The following algorithm outlines a PSO based image
classification (Omran et al., 2002). In this algorithm, a single
particle xi represents N cluster means such that xi=(mi1,...,mij,…,miN) where mij represents the j-th cluster centroid vector of the i-th
particle. Therefore, a swarm represents a number of candidate cluster
centers. The fitness of each set of cluster is measured using:
where zmax=2s -1 for an s-bit image; Z is a matrix representing the assignment of pixels to clusters of particle i. Each element zijp indicates if pixel zp belongs to cluster Cij of particle i. The constants w1 and w2 are user defined constants. Also,
is the minimum Euclidean distance between any pair of clusters. The algorithm is as follows:

Step 1: Initialize cluster centers for each particle randomly.
Step 2: For each particle, assign each pixel to a cluster that has the minimum distance to its cluster center.
Step 3: Calculate the fitness function
for each particle and find the global best solution. Step 4: Update the
cluster centers using Eqs. (8) and (9).
Step 5: Repeat the procedure until the stopping criterion is reached.
4. Conclusion
Experimental results showed that SI
techniques can improve the K-means and the SCL algorithms in
recognizing the clusters. The K-means algorithm often fails to realize
clusters since it is heavily dependent on the initial cluster centers.
The ACO-K-means and PSO-K- means algorithms provides a larger search
space compared to the K-means algorithm. By employing these algorithms
for clustering, the influence of the improperly chosen initial cluster
centers will be diminished over a number of iterations. Therefore,
these algorithms are less dependent on randomly chosen initial seeds
and is more likely to find the global optimal solution.
We have also shown that SI can be
beneficial to the SCL algorithm. SI can help SCL find the global optima
using the same parameter set and learning rate as those used in the SCL
and recognize the clusters where the SCL fails to do, in some cases.
This can be advantageous since for SCL to find the global optima the
learning rate should be adjusted in the course of experimentation.
5. References
Dorigo, M.; Maniezzo, V. & Colorni, A. (1996). Ant system: optimization by a colony of cooperating agents, In: IEEE Transactions on Systems, Man and Cybernetics, Part B, Vol. 26, 1996, pp. 29-41
Gonzalez, R.C. & Woods, R.E.
(1992). Digital Image Processing. Addison-Wesley, 1992 Hertz, J.;
Krogh, A. & Palmer R.G. (1991). Introduction to the theory of
neural computation,
Addison-Wesley, Redwood City, 1991
Hung C.C. (1993). Competitive learning networks for unsupervised training, INT. J. Remote Sensing, vol. 14, no. 12, 1993, pp. 2411-2415
Kaewkamnerdpong, B. & Bentley, P.J. (2005). Perceptive Particle Swarm Optimisation: an Investigation, IEEE Swarm Intelligence Symposium, pp. 169-176, Pasadena, CA, USA, June, 2005
Kennedy, J. & Eberhart, R. (1995). Particle Swarm Optimization, In: Proceedings of IEEE International Conference on Neural Networks, pp.1942-1948, 1995
Li, Y. & Xu, Z. (2003). An Ant Colony Optimization Heuristic for Solving Maximum Independent Set Problems, In: Proceedings of the 5th International Conference on Computational Intelligence and Multimedia Applications, pp. 206-211, Xi'an, China, Sept. 2003
McQueen, J.B. (1967). Some Methods of
Classification and Analysis of Multivariate Observations, In L. M.
LeCam and J. Neyman, editors, Proceedings of the Fifth Berkeley Symposium on Mathematical Statistic and Probability, pp. 281-297, University of California Press, Berkley, CA, 1967
Omran, M.; Salman, A. & Engelbrecht, A.P. (2002). Image Classification Using Particle Swarm Optimization, 2002
Pham, D.T. & Karaboga, D. (2000). Intelligent Optimization Techniques: Genetic Algorithms, Tabu Search, Simulated Annealing and Neural Networks, Springer, 2000
Rumelhart, D.E. & Zipser, D. (1986). Feature discovery by competitive learning, In Parallel Distributed Processing: Explorations in the Microstructure of Cognition, eds. J.L. McClelland & D.E. Rumelhart, MIT Press, Cambridge, M.A., 1986, pp. 151-193
Saatchi, S. & Hung, C.C. (2005).
Hybridization of the Ant Colony Optimization with the K- means
Algorithm for Clustering, Image Analysis, Proceedings Lecture Notes in Computer Science 3540, 2005, pp. 511- 520
Saatchi, S.; Hung, C.C. & Kuo,
B.C. (2006). A comparison of the improvement of k-means and simple
competitive learning algorithms using ant colony optimization, In
Proceedings of the 7th International Conference on Intelligent Technology, Taipei, Taiwan, December, 2006
Tou, J.T. & Gonzalez, R.C. (1974).
Pattern Recognition Principles, Addison-Wesley, 1974 van der Merwe,
D.W. & Engelbrecht A.P. (2003). Data Clustering Using Particle Swarm
Optimization, 2003 Congress on Evolutionary Computation, 2003, pt. 1, Vol.1, pp. 215- 220
Wilson, E.O. (1975). Sociobiology: the
new synthesis, Belk Press, Cambridge, MA, 1975 Zheng, H.; Zheng, Z.
& Xiang Y. (2003). The application of ant colony system to image
textute classification [textute read texture], In: Proceedings of the 2nd International Conference on Machine Learning and Cybernetics, vol. 3, pp. 1491-1495, Xi'an, China, Nov. 2003