1 INTRODUCTION
Data uncertainty occurs in any step of data processing. It can stem from or be enlarged by measurement, collection, aggregation, transformation, communication, propagation, modeling, conceptualization, or aging. In complex models, data is collected from various sources, rearranged to fit the present needs, processed under model assumptions, and propagated by serving as input to processes within the model. Concordantly, this also holds true for data uncertainty (MacEachren, 1992, MacEachren et al., 2005). Since uncertainty is usually enlarged by data processing, the usefulness of the data generated within such a model can only be validated when its uncertainty is considered. Statements about uncertainty can change the decision on how to proceed with which data. Thus, uncertainty can change the final result.
Uncertainties arise, e.g., in the process of modeling the interdependencies between socio-demographics and infrastructure. It is easy to see that these two influence each other. Facilities to provide a particular service are geared towards a population. They must either serve a specified number of people or be accessible within a specified time. Infrastructure services might be influenced by the specific needs or characteristics of the population around the facility. On the other hand, the infrastructural equipment might attract or repel people and therefore has influence on the population and its characteristics.
A concrete example for an facility-based infrastructural unit is the supply of the city of Hamburg with ambulances. In Hamburg, ambulances are situated at rescue stations which are distributed over town. If an emergency occurs, the emergency headquarter will order an ambulance to the emergency site. In most cases, emergencies will be served by ambulances from stations which are closest to the incident. In some cases, however, all ambulances from one station might be busy so that an ambulance from another station must be alarmed. Also, an ambulance might be traversing areas which are usually served by ambulances from other stations and then called to a mission. This happens, for example, when an ambulance is on the way back from a hospital.
In this paper we will show the outline for a complex model of an urban process. Uncertainties will be explicitly considered. We want to build a model which can serve to predict future emergencies for the city of Hamburg. This model will be based on the relationship between the socio-demographic characteristics of city districts and the amount of emergencies which happen in them. The districts in Hamburg vary in their socio-demographic form. Employees from the fire department mentioned to us that they could observe a variation of amount and type of incidents with regard to the socio-demographic extent of a district.
We will then continue to estimate future outcomes of socio-demographic attributes and use these estimates as a basis for predicting the future amount of emergencies. In this work, repeatedly uncertain information is used for calculating, estimating, or predicting information. This resulting information in turn will be uncertain, too. We want to consider several methods to model this uncertainty, use them and compare them. We want to gain insights into the usefulness of existing approaches for considering uncertainties and possibly detect potential for new approaches. We will continue with presenting and discussing related work in section 2. In section 3 we will present the data sets we will use, before we explain our approach in more detail in section 4. There we will also explicitly address the consideration of uncertainties. We will close with an outlook on possible future works in section 5.
2 PREVIOUS WORK
At the beginning of the decade, a health mapping for the city of Hamburg was set up. Cost grow operations were performed on data about roads and rescue station locations. Thus it was examined which parts of the city could be reached from stations within a given time. Later the number of emergencies actually occurring in these areas was counted. This allowed for suggestions for reassignment of areas or ambulances to stations or even relocations of stations.
The results of the health mapping showed that 53.6% of the city area could be reached within five minutes by ambulances. In this area, 78.3% of all incidents occurred. Health mapping suggested relocations of the stations which led to a coverage of 55.3% of the city area and 86.6% of all incidents by ambulances within five minutes (Traub, 2003, Traub, 2004, Albers, 2001, Henning, 2001). The results of this work are shown in Figures 1 and 2.
 Figure 1: Actual distribution of rescue stations |
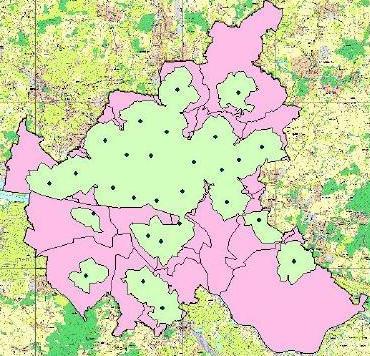 Figure 2: Optimized distribution of rescue stations |
Figure 1 shows the distribution of rescue stations before optimization, figure 2 shows the distribution after optimization. In both images, dots represent rescue stations, the smaller areas represent the parts that can be reached within five minutes from a rescue station, and the larger areas show the regions which are usually served by the corresponding rescue stations.
Krisp and Karasova examined the relationship between population density and emergency incidents (Krisp and Karasova, 2005). Whilst they found that the correlation was significant, it also became clear that there must be more factors determining the occurrence of emergencies. In later studies, not only the population density, but also the variation of people’s location during day or night (Ahola et al., 2007, Krisp, 2008), the temporal distribution of incidents (Spatenkova et al., 2007) or the age of the patients was considered. The findings revealed that emergencies are most frequent in areas with many elderly people. Also, the type of incident varies with age distribution (Spatenkova and Krisp, 2007).
3 USED DATA SETS
For our work we will use two different data sets: One about the emergencies and one about the socio-demographic data.
The data set about the emergencies consists of emergency calls that came in at the emergency headquarter of Hamburg between 2004 and 2008. Each emergency is attributed with
- the date
- the time of day
- the ambulance which served the emergency
- the kind of emergency
- the sex of the patient
- the patient’s birth year
- the destination to which the patient was brought (in most cases this would be a hospital)
- the site of the emergency
Due to data restrictions, the site of the emergency is not indicated by geographic coordinates or treet and house number, but only by street. This leads to the unusual case that most emergency sites are included as line features. Furthermore, some emergencies’ sites are not even encoded by street but by prominent buildings or other sites, such as urban railway-stations, doctor’s offices, schools, hotels, parks, or others.
The other data set contains various socio-demographic attributes of city districts of Hamburg between 1986 and 2007. It is publicly available from the statistical office for Hamburg and Schleswig-Holstein. The set consists of more than one hundred variables regarding population, age distribution, income, employment, crimes, and migrations. However, some of the data is only available since, until, or for certain years.
Furthermore, the meaning of the attributes shifted throughout time. There have been changes regarding the area of districts as well as in attribute meaning. In 2008, new districts were created by taking parts from other districts. One district was dissolved. Regarding the thematic attributes, the limitations might vary from year to year. For example, in the values for young people’s unemployment, it is not handled uniformly at which age a person is considered ’young’. Additionally, some of the data is only estimated. For example, the latest census in Germany was taken in 1987. Therefore, data about population size is not very certain and sometimes receives sudden shifts when the register of residents are cleansed from multiple faulty entries at once.
4 OUTLINE OF OUR APPROACH
In this section, we outline our plans for a model for analyzing the relationships between socio-demographic factors and the amount of emergencies within city districts. We also tell how we plan to use this model to predict the future occurrences of emergencies. Still, our focus will lie on the identification, treatment, and description of uncertainties within the analysis. For implementing the model and describing the uncertainties we plan to use Java and R.
As a first step we want to prepare the data for the analysis. To do so, we will detect missing data, redundant data, and obviously wrong values. These values might be removed or replaced by interpolated values in order to receive data which is free of perturbing influences.
Considering uncertainties at this part of the analysis will be difficult, since no a priori information about the data sets is available. The most sensible solution at this point seems to us to consider the information certain (or at least certain enough for our purpose).
The next step is to come up with the total number of emergencies per district. The majority of emergency sites are encoded by street. Since in most cases a street is fully contained within one district, most emergencies can unambiguously be assigned to a district. More unclear cases occur when a street runs through one or more districts. In these cases, several options exist. Let ci be the counter of emergencies for district i, n be the number of districts the street runs through, and p(i) the percentage of the street which runs through district i. Possible choices for an updated counter value cinew are shown in equations (1), (2), and (3).
 | (1) |
 | (2) |
 | (3) |
- Counter c1 which counts emergencies occurring in every street which lies completely within or runs through the district
- Counter c2 which estimates the real value by using one of the approaches shown above in equations (1), (2), or (3)
- Counter c3 which counts only emergencies occurring in streets which are fully contained within a district
| c1 >= c2 >= c3 | (4) |
- the number of emergencies which have been served by ambulances from a certain station in a certain district
- the overall number of emergencies occurring in one district
- the likeliness of ambulances from one station to serve emergencies in other districts
- the distance from the district to the rescue station
In the next step we want to apply a model in which the sociodemographic factors serve to estimate the total number of emergencies per district. Since the relationship between socio-demographics and occurring emergencies is yet unknown, we cannot make prior assumptions about which variables to use. A method to deal with this special problem would be stepwise regression. However, when stepwise regression is applied thoughtlessly, it can introduce numerous uncertainties. The weaknesses and shortcomings of stepwise regression are widely recognized (Whittingham et al., 2006). Analysts are tempted to regard to a suggested model as the single best model, unaware of or indifferent to the fact that there often are various models which deliver results of similar quality. A problem with stepwise regression is the choice of which variables to include into the model. Depending on the sequence in which variables have been inserted into or taken out of the model, different models will be produced. To overcome these weaknesses, it is helpful to consider not only the best, but also other well-fitted models. Model-selection criteria have been developed in order to cope with the uncertainties arising here (Akaike, 1974, Burnham and Anderson, 2002). Still, considering uncertainty will be difficult in this step, too.
A further aspect will be the continuation of the socio-demographic factors. Models for continuation of demographic factors (i.e., population) mostly consist of four variables: Births, deaths, immigration, and emigration. Whilst births and deaths can be estimated quite reliably, immigration and emigration underlie influences which are very hard to foresee. Regarding the other sociodemographic factors (e.g., the development of the unemployment rate), we plan to apply time series analyses in order to produce an estimation of the future outcome of values. We still have to learn about the function of models which are appropriate for this task before we decide on how to best describe the uncertainties of predicted values. We expect that uncertainty grows with passing time, so that the estimates for the next years might be quite accurate, whilst estimates for later years will be more uncertain.
These predicted values and the regression model will serve to eventually estimate future outcomes of emergencies per district. Because the uncertainty is described for both model variables and predicted values, we will be able to make a statement about the uncertainty of the model estimates.
We expect that at this point of the model the uncertainty might have become very large. This means that many outcomes appear probable. A concern is that the uncertainty is eventually so large that the model becomes useless. Users might be repelled by large uncertainties and decide not to consider estimates of which they are told that they are very uncertain. In order to tackle the problem of broad uncertainty borders, we could exclude values which are very improbable from the model and consider only values which have a probability value that surpasses some threshold.
5 CONCLUSIONS AND FUTURE WORK
This paper has shown the outline of a project under development. It deals with various aspects, such as
- the examination of the relationship between socio-demographic variables and the amount of emergency incidents
- the prediction of the amount of future emergencies
- dealing with uncertainties that occur at various stages within a model
A more realiable model could be constructed by using sociodemographic data for areas which are smaller than districts. Also, more refined data about age distribution might be helpful. This would allow for a refinement of the regression parameters and thus less uncertainty in the model. However, when the administrative areas are smaller, less streets would be fully contained in them and less emergencies could be assigned unambiguously.
After amounts of emergency have been predicted for each district, they could be used to estimate the future mission load of a station. A part of this task would consist of analyzing which districts are served by ambulances of which rescue station by which percentage. Such a model would require special consideration and description of its uncertainties. If a certain threshold of emergencies per station is exceeded, this could mean that new ambulances or rescue stations are required.
A former plan of ours was to apply a micro-simulation in which the service of emergencies by ambulances over the course of one year would be simulated. This could be repeated numerous times in order to produce a Monte Carlo-simulation. The results of such a simulation can be used to describe uncertainties via probability density functions. We dropped this plan due to its complexity and missing information about typical ambulance movement. However, this approach might be part of future work, since it would allow for the consideration of various aspects which are not included in our current model. Among these aspects are seasonal changes and navigation in an urban area with several natural barriers such as the river Elbe.
Other possible fields for future work would be a new cost growanalysis based on the changed population data or an examination of the relationships between socio-demographic factors and the temporal attributes or the types of emergencies.
ACKNOWLEDGEMENTS
The authors would like to thank the fire department of Hamburg for their kind cooperation.
REFERENCES
- Ahola, T., Virrantaus, K., Krisp, J. M. and Hunter, G. J., 2007. A spatio-temporal population model to support risk assessment and damage analysis for decision-making. International Journal of Geographical Information Science 21, pp. 935–953.
- Akaike, H., 1974. A new look at the statistical model identification. IEEE Transactions on Automatic Control 19, pp. 716–723.
- Albers, M., 2001. GIS-gest?utzte Untersuchung zur distanzabh angigen Optimierung der Einsatzgebiete der Hamburger Feuerwehr. Diploma thesis (not published), HafenCity University Hamburg, formerly Fachhochschule Hamburg, Hamburg.
- Burnham, K. P. and Anderson, D. R., 2002. Model Selection and Multi-Model Inference: A Practical Information-Theoretic Approach. Springer-Verlag, New York.
- Henning, M., 2001. Raumliche Analyse der Rettungswachen der Berufsfeuerwehr Hamburg mit Hilfe eines Geoinformationssystems. Diploma thesis (not published), HafenCity University Hamburg, formerly Fachhochschule Hamburg, Hamburg.
- Krisp, J. M., 2008. Geoinformation for Civil Protection - Tracking Mobile Phones as a Data Source. CivPro column of the month.
- Krisp, J. M. and Karasova, V., 2005. The relation between population density and fire / rescue service incidents in urban areas. In: Proceedings on the 10th Scandinavian Research Conference on Geographical Information Science (ScanGIS), pp. 237–246.
- MacEachren, A. M., 1992. Visualizing Uncertain Information. Cartographic Perspective (13), pp. 10–19.
- MacEachren, A., Robinson, A., Hopper, S., Gardner, S., Murray, R., Gahegan, M. and Hetzler, E., 2005. Visualizing Geospatial Information Uncertainty: What We Know and What We Need to Know. Cartography and Geographic Information Science 32(3), pp. 139–160.
- Morgan, M. G. and Henrion, M., 1990. Uncertainty: A Guide to dealing with uncertainty in quantitative risk and policy analysis. Cambridge University Press, Cambridge, United Kingdom and New York.
- Traub, K.-P., 2003. Geomedical Information Systems. The Application of GIS to Health Mapping Case Hamburg. Geoinformatics 6, pp. 20–23.
- Traub, K.-P., 2004. Geoinformationssysteme im Gesundheitswesen. Einfuhrung und praktische Anwendung. Wichmann, chapter Die Untersuchung der r?aumlichen Verbreitung von Gesundheitseinrichtungen mit GIS am Beispiel Hamburg, pp. 241–255.
- Spatenkova, O. and Krisp, J., 2007. The Use Of Contingency Tables To Value Variables For Spatial Models. In: The 5th International Symposium on Spatial Data Quality, Enschede, The Netherlands.
- Spatenkova, O., Dem?sar, U. and Krisp, J. M., 2007. Selforganising maps for exploration of spatio-temporal emergency response data. In: I. Maynoth (ed.), Processings of Geocomputation 2007.
- Whittingham, M. J., Stephens, P. A., Bradbury, R. B. and Freckleton, R. P., 2006. Why do we still use stepwise modelling in ecology and behaviour Journal of Animal Ecology 75, pp. 1182–1189.