|
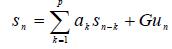
Robust Speaker Identification Based on Perceptual Log Area Ratio and Gaussian Mixture Models Авторы: David Chow, Waleed H. Abdulla Источник: http://www.ele.auckland.ac.nz/~wabd002/ICSLP%20Speaker%20ID%20as%20submitted.pdf Abstract This paper presents a new feature for speaker identification called perceptual log area ratio (PLAR). PLAR is closely related to the log area ratio (LAR) feature. PLAR is derived from the perceptual linear prediction (PLP) rather than the linear predictive coding (LPC). The PLAR feature derived from PLP is more robust to noise than the LAR feature. In this paper, PLAR, LAR and MFCC features were tested in a Gaussian mixture model (GMM) based speaker identification system. The F-ratio feature analysis showed that the lower order PLAR and LAR coefficients are superior in classification performance to their MFCC counterparts. The text-independent, closed-set speaker identification accuracies, as tested on KING, YOHO and the down-sampled version of TIMIT databases were 98.81%, 85.29%, 97.045% using PLAR, 97.92%, 61.76%, 94.76% using LAR and 96.73%, 84.31%, 96.48% using MFCC. Those results showed that PLAR is better than LAR and MFCC in both clean and noisy environments. 1. Introduction Feature extraction is the key to the front-end process in speaker identification systems. The performance of a speaker identification system is highly dependent on the quality of the selected speech feature. Most of the current proposed speaker identification systems use mel frequency cepstral coefficients (MFCC) and linear predictive cepstral coefficients (LPCC) as feature vectors [1]. Currently, researches are focusing on improving these two cepstral features [2] or appending new features on them [3]. Although MFCC and LPCC were proved to be two very good features in speech recognition, they are not necessarily being as good in speaker identification. In fact, it is generally believed that the spectrum smoothing done by MFCC and LPCC has some sort of speaker normalization effect. For a speech feature used in speaker identification to be effective, it should reflect the unique properties of the speaker’s vocal apparatus and contains little or no information about the linguistic content of the speech [4]. Linear predictive coding (LPC) coefficients contain rich speaker’s information and its derivative, Log area ratio (LAR), has the same characteristic too. LAR feature is better than LPC in speaker identification because it has a linear spectral sensitivity and it is more robust to quantization noise [5]. Apart from this, the GSM coded speech is transmitted using LAR feature [6]. Therefore, LAR is more compatible to GSM coded speech than MFCC. However, LPC is very susceptible to noise which makes its derivative, LAR, also sensitive to noise. In this paper we overcome this problem by deriving the LAR coefficients from PLP instead of LPC. The new feature is called perceptual log area ratio (PLAR). PLP is very similar to LPC except that it takes the human perceptual behaviour into account. It has been shown that PLP is robust to noise. Thus, we believe that PLAR will also be robust to noise. In 1995, Reynolds demonstrated that a Gaussian mixture model (GMM) based classifier works well in text-independent speaker identification even with speech feature that contains rich linguistic information like MFCC [3, 7]. With the above results, the authors believe that using PLAR based features as feature vectors in the GMM-based speaker identification system will yield a very good identification result. In this paper, the performance of the PLAR feature is investigated thoroughly with the aid of the F-ratio analysis. A series of experiments about the performance of PLAR feature on a speaker identification system are reported. The paper is organized as follows; section 2 gives a description of the LAR feature. Section 3 explains the GMM-based speaker identification system used in this paper. Section 4 compares the performance of the PLAR, LAR and MFCC features. Section 5 derives conclusions out of this work. 2. Perceptual log area ratio coefficients PLAR coefficients are closely related to the LAR coefficients which are derived from the LPC. LPC based feature is a highly effective representation of speech signals. In this respect, each speech sample is represented by a weighted sum of p
where p is the order of the LPC filter, sn is nth speech sample and ak is the kth coefficient of the LPC vector. These coefficients are found by Durbin algorithm which minimizes the mean square prediction error of the model [5, 8]. The autocorrelation matrix is needed to be found before applying Durbin algorithm. The autocorrelation matrix can be found in frequency domain. PLP coefficients calculation is very similar to LPC coefficients calculation except that when calculating the autocorrelation matrix, three steps have to be taken to reflect the human perception of sound. These three steps are [9]:
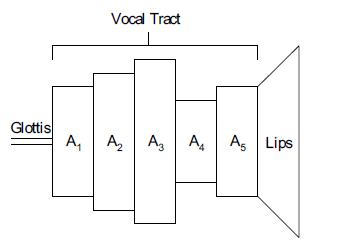
Figure 2.1: Acoustic tubes speech production model. In this model, the length of each cylindrical tube is closely related to the sampling period and the number of coefficients in the PLP model. Therefore, in calculating the PLAR coefficients, the vocal tract length is not needed to be specified. The PLAR coefficients are formed by the log area ratio between the cross-section areas of every two connected tubes. The number of cylindrical tubes in the model is equal to the number of PLAR coefficients plus one. The relationship between the PLAR and the PLP coefficients is:
Where
Where 3. Gaussian mixture model based speaker identification system In the speaker identification system under investigation, each speaker enrolled in the system is represented by a Gaussian mixture model (GMM). The idea of GMM is to use a series of Gaussian functions to represent the probability density of the feature vectors produced by each speaker. The mathematical representation is:
where M is the number of mixtures, x is the feature vector, wi is the weight of the i-th mixture in the GMM,
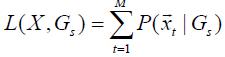
where x is the sequence of speaker feature vectors, and M is the total number of feature vectors [3, 7]. A GMM that generates the highest L(X,Gs) score is identified as the producer of the incoming speech signal. This decision method is called maximum likelihood (ML). 4. PLAR performance evaluation Three experiments have been conducted on three different speech databases. The speech signal was extracted by using an energy based algorithm. No pre-emphasis filter was applied to the signal. The analysis of speech signal was conducted over the speech frames of 20ms duration with 10ms overlapping. The windowing function used was Hamming window. The length of the window is chosen so that there are enough speech samples in each frame to estimate the speech spectrum and make it insensitive to the window placement with respect to pitch periods. The classification engine used in this experiment was based on a 32 mixtures GMM classifier initialized by vector quantization (VQ) [11]. 4.1. Performance with TIMIT database TIMIT is a noise free speech database (53dB SNR) recorded using a high quality microphone sampled at 16 kHz. In this paper, all the 168 speakers in the testing folder of TIMIT were used in this experiment. The speech signal was passed through a 30th order FIR low-pass filter first, then down-sampled from 16 kHz to 8 kHz. In TIMIT, each speaker produces 10 sentences, the first 8 sentences were used for training and the last 2 sentences were used for testing. The average length of each sentence is 3 seconds. In other word, there was about 24 seconds of speech for training and 6 seconds for 2 tests with 3 seconds for each test. 4.1. Performance with TIMIT database 4.1.1. F-ratio analysis in TIMIT F-ratio is a figure of merit to evaluate the effectiveness of feature coefficients and it can be formulated by:
Figure 4.1 compares the F-ratio of the PLAR, LAR, and MFCC features. This figure exhibits that the lower order coefficients of both PLAR and LAR features have higher F-ratio scores than the MFCC counterpart. For text-independent speaker identification, the F-ratio score is a good indication to the quality of the features despite the three assumptions required by the F-ratio are not fully met. These three assumptions are: [12]
Figure 4.1: The F-ratio score of PLAR, LAR and MFCC. 4.1.2. Identification results on TIMIT Reynolds’s work [7, 13] has been replicated and used as a base system to benchmark the performance of the proposed PLAR feature. Comparative results are depicted in Table 4.1. It can seen that the speaker identification accuracy obtained by using the proposed feature under the full TIMIT-band (i.e. 0 – 8000Hz) is almost the same as those obtained by Reynolds. The number of coefficients used per feature vector is 20. Table 4.1: The identification rate of MFCC based speaker identification system under TIMIT-band speech.
In a second experiment the TIMIT-band is down sampled to cover only 4000Hz. Figure 4.2 shows that the identification rates based on 18, 20, 22, and 23 coefficients PLAR feature vectors are the best. We chose 20 coefficients to be the feature vectors length to perform a fare comparison with the Reynolds work where 20 coefficients have been chosen. Table 4.2 compares the identification rate using 20 PLAR, 20 LAR and 20 MFCC coefficients. It also shows the identification rate obtained by replicating Reynolds work. From this table, the identification rate using the MFCC is 96.73% as compared to 98.81% obtained by using PLAR. A 2.08% improvement is achieved. The identification results obtained in this paper using MFCC on TIMIT database is higher (96.73%) than that obtained by Reynolds (95.2%) [13] although we are replicating his experiment. The probable reason is that he used the telephone pass-band (300Hz – 3400Hz) where in this paper we cover a bit wider (0 – 4000Hz) bandwidth. Table 4.2: The identification rate of the PLAR feature, the LAR feature and the MFCC feature.
4.2. Performance with KING database There are two recording versions in KING database. The first one recorded by a microphone and the other one recorded by a telephone. The telephone recordings are considered to be noisy. Half of the speech samples have 10 – 20 dB SNR, others have ~30 dB SNR. Both recordings were sampled at 8 kHz. In this paper, all the 51 speakers of the telephone version of the KING database were used in this experiment. In KING, each speaker produces 10 sessions of recording, the first 3 sessions were used for training and the last 2 sessions were used for testing. For the speech samples in King database which were recorded in San Diego, the spectral distortion appeared in sessions 1 to 5 is very different to the one in sessions 6 to 10. Therefore, only the first 5 sessions were used in this paper. In this experiment, all the features have undergone cepstral mean normalization (CMN) to remove the effect of channel mismatch and addictive noise. Traditionally, CMN is only applied to cepstral feature in order to remove the channel effect. However, the speech degradation in KING mainly comes from additive noise and applying CMN process among MFCC, LAR and PLAR features mitigates the additive noise effect. Speech signal band-limiting to 300 – 3400Hz has been applied to the extraction process of all of the three features. Table 4.3 shows the identification accuracies using the three features. It also includes Reynolds’s result for reference. From the table, the identification accuracy obtained by PLAR is 85.29% which is better than the one obtained by MFCC. Moreover, it can be seen that the LAR feature performed poorly under noisy speech. Table 4.3: The identification rate of the PLAR feature, the LAR feature and the MFCC feature.
4.3. Performance with YOHO database YOHO speech database is recorded using a telephone handset under real office environment and sampled at 8 kHz (43 dB SNR). In this paper, all the 138 speakers in YOHO were used in this experiment. YOHO is a vocabulary constrained speech database which contained only combination lock phrases. All the phrases in the “ENROLL” folder were used to train the system and each phrase in the “VERIFY” folder was used in testing. Therefore, there were about 6 minutes speech used for training and 2.4 seconds speech used in each test. 40 tests per speaker have been carried out in the experiments. Table 4.4 shows the identification accuracies using the three different features. From the table, the identification accuracy obtained by using PLAR is 97.05% which is slightly better than the one obtained by MFCC; 96.48%. The successful rate obtained by using LAR is 94.76% which is the least among PLAR and MFCC. This is expected as it is susceptible to noise due to the use of LPC in its derivation. Table 4.4: YOHO database identification rate using the PLAR, LAR, and MFCC features.
5. Conclusions In this paper we have demonstrated a new feature for speaker identification system called PLAR. Using 20 PLAR coefficients an identification rate of 98.81% has been achieved in comparison to 96.73% obtained by the commonly used MFCC feature using the noise free speech database (TIMIT, 53dB SNR) and bandwidth of 4KHz. LAR performs the second in this experiment by achieving an identification rate of 97.97%. Moreover, PLAR feature outperforms LAR and MFCC features when used in high noise speech database (KING, 10 – 30 dB SNR), table 4.3, and moderate noise speech database (YOHO, 43 dB SNR), table 4.4. These experiments confirm that PLAR feature is robust to noise. The F-ratio analysis showed that the lower order PLAR coefficients are more efficient than the lower order MFCC coefficients in capturing the speaker’s related information. The PLAR like LAR is more compatible to GSM coded speech than the MFCC which means the PLAR has potential to be used in mobile speaker identification system. 6. Acknowledgements This work is supported by The University of Auckland Vice Chancellor Development Fund, project 23109 and The University of Auckland Research Fund, project 3602239/9273. 7. References
|
|||||||||||||||||||||||||||||||||||||||||||||||||
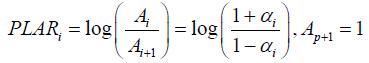
 the ith PLP based parcor coefficients which can be found by:

 is the ith PLP coefficient calculated by the ith order PLP model.
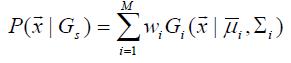
 is the mean of the i-th mixture in the GMM, and
  is the covariance matrix of the i-th mixture in the GMM [3, 7]. The Model parameters characterize a speaker voice in the form of probabilisty density function. They are determined by the Expectation maximization (EM) algorithm [10].
In the identification phase, the log-likelihood scores of the incoming sequence of feature vectors as subjected to each speaker model are calculated by:
is the covariance matrix of the i-th mixture in the GMM [3, 7]. The Model parameters characterize a speaker voice in the form of probabilisty density function. They are determined by the Expectation maximization (EM) algorithm [10].
In the identification phase, the log-likelihood scores of the incoming sequence of feature vectors as subjected to each speaker model are calculated by: