Inferring Geological Structures Using Wavelet-Based Multiscale Edge Analysis and Forward Models
Darren J. Holden, Nicholas J. Archibald, Fabio Boschetti, Mark W. Jessell
Key Words: wavelet, potential field, forward models, multiscale edge detection, NoddyTM
ABSTRACT
A set of semi-automatic tools for analysis of potential field data has been developed. These tools use wavelet analysis to automatically detect gradients or edges in potential field data. The tools are normally applied to different levels of upward continuation, providing automatic detection of edges in the potential field data at different scales of resolution. We refer to these edges at different levels of upward continuation as "multiscale edges".
Commonly, sharp contrasts evident in potential field data (edges or gradients) are assumed to result from sharp discontinuities or interfaces between contrasting rock materials such as faults, unconformities, or intrusive contacts. Because of the inherent non-uniqueness of potential field problems, there can be no certain or unambiguous differentiation between different possible source rock geometries without reference to a priori information such as independent geological data. In many cases the a priori information which is most readily available describes a geological "style" which consists of some form of idealised or simplified geometry or expected range/strength of contrasts in rock properties.
The common assumption that geological units are sharply bounded by faults and other geological contacts suggests that irregularities in geophysical potential-field images correspond to irregularities in the sub-surface rocks, and this relationship has been the basis for many forward and inverse modelling systems (Jessell, 1999). In order to document the results of the new, semiautomatic edge detection techniques, these techniques have been applied to synthetic datasets (Jessell, 1981; Jessell & Valenta, 1996). Each synthetic dataset investigates an idealised source geometry (e.g. intrusions, faults, dykes) the expected potential field data, and the resulting multiscale edges. The resulting "atlas" of source geometries and multiscale edges aids the interpretation of real-world data. The new analysis techniques and the "atlas" of multiscale edges, have direct application to calculations of depth to source, dip directions, and contact relationships.
INTRODUCTION
In both gravity and magnetic data most of the information is contained in irregularities in the analytical signal which in turn, map the boundaries of contrasting properties of subsurface rocks (contacts, faults, etc). The detection and visualisation of these irregularities at different scales (multiscale edges) can greatly enhance the interpretation of potential field data in terms of the 3D geology (Hornby, et al., 1999).
Multiscale edge mapping is an automatic process of picking edges in potential field data at a variety of different scales (Hornby, et al., 1999; Archibald, et al., 1999). On a horizontal plane these edges form isolated "worms" which are similar to isolated lines drawn by a geoscientist manually interpreting a potential field dataset (e.g. contacts along maximum gradients). When derived in 3D these 'worms' form surfaces whose shape and associated parameters are a function of the 3D subsurface geometry of rocks with contrasting properties.
Interpretations have been undertaken of potential field datasets at various geological scales using multiscale edge analysis. Because the wavelet-based edges are free from operator bias they can pick discontinuities at all scales from fine-scales (highfrequency, short wavelength) at low levels of upward continuation to coarse scales (low-frequency, long wavelength) at high levels of upward continuation.
Analysis is performed on synthetic models produced by NoddyTM software to provide an atlas of wavelet edges from a variety of geological structures. By comparing the atlas with the wavelet based edges from real datasets it is possible to constrain the inherent ambiguities in realistic geological scenarios. This provides a platform for the interpretation of real-world 3D geological features.
ATLAS OF STRUCTURAL GEOPHYSICS (NODDYTM ATLAS)
The Atlas of Structural Geophysics was developed as a training tool to demonstrate the relationship between three-dimensional structure and resulting potential fields (Jessell, 1997a, 1997b). The atlas has been developed in two forms: as a paper document, and as an on-line resource (www.earth.monash.edu.au/AGCRC/ASG/). The on-line version is the more recent, and contains models calculated for both southern hemisphere and northern hemisphere latitudes. The potential-field calculations are based on the equations of Hjelt (1972, 1974) and allow arbitrarily complex structures to be analysed.
In the wavelet analysis technique all magnetic data must be first reduced to the pole, so only those models in the atlas calculated at the poles are used. In order to provide sufficient resolution for the technique, all the relevant atlas models were recalculated at a voxel size of 1 m.
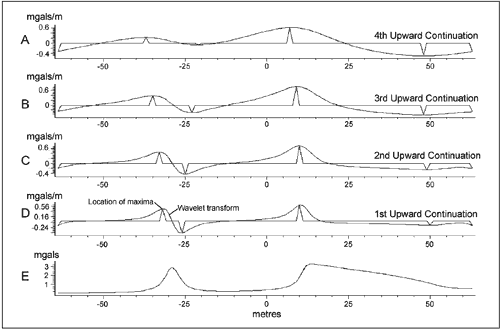
Fig. 1. The concept of multiscale edges. (a) displays the gravity profile, with (b), (c), (d) and (e) showing four scales of upward continuation with edges marked as spikes and horizontal derivative as curved lines.
CONCEPTUAL BASIS OF MULTISCALE EDGE ANALYSIS
Potential field theory is suitable for multiscale wavelet analysis. In the last decade wavelet analysis has been proposed in various fields, including image processing, mainly as an alternative to Fourier analysis. The rationale for this lies in the localization properties of wavelets. This is particularly important in geoscience, in which we are not only interested in knowing what features are present in a data set, but also where they are.
The examples presented in this paper are based upon a generalisation of the concept of edges, and they draw upon recent results in the wavelet processing of images (e.g. Mallat & Zhong, 1992). By applying this approach to potential field theory, Hornby et al. (1999) have shown that, with the choice of an appropriate wavelet, derived from Green's function of gravitational acceleration, the measured potential field or its spatial derivatives can be treated as a wavelet transform of the source distribution.
Many traditional potential field operations have an elegant and compact expression in wavelet domain, the most obvious being the equivalence between the concept of change of scale and upward continuation. This results in a mathematically common and rigorous framework for different potential field applications. The reader is referred to Hornby et al. (1999) for a formal presentation of the underlying theory, to Archibald et al. (1999) for the application of multiscale edges to the enhanced visual interpretation of potential field data, to Boschetti et al. (1999) for applications to feature-based signal processing and Boschetti et al. (2000) for application to mathematical inversion.
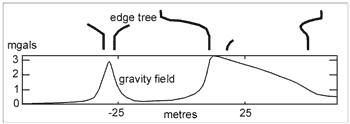
Fig. 2. Collection of the multiscale edges is defined as an edge tree (same gravity profile as Figure 1).
In Figure 1 the concept of multiscale edges is illustrated. Figure 1e is the gravity profile, and Figures 1a-1d its horizontal derivative. An edge is defined as a local extrema in the horizontal derivative. The spikes mark the locations of four edges in each of the four horizontal derivative profiles (Figs 1a to 1d). Analysis of these edges in the profiles at different scales (i.e. at different levels of upward continuation, as mentioned above) is multiscale edge analysis. The collection of the multiscale edges is defined as edge tree and is shown, for the same gravity profile, in Figure 2.
Multiscale edge analysis indicates that the location and amplitude of edges contain the same information as the original profile. Accordingly, information about causative sources can be obtained by analysing the multiscale edge. This simplifies the geological reconstruction and visual analysis of maps. Figure 3 shows how the estimation of the dip of a fault can be obtained by simply looking at the location of the multiscale edges.
The change of magnitude of the multiscale edges as a function of scale, also provides information about the depth and kind of causative sources. Block-shaped sources give a different signature compared to dykes and line sources. This is treated extensively in Hornby et al. (1999), where examples of numerical inversion are given. Figure 4 shows the variation of multiscale edges at different heights from a block-shaped source. Note the effect of the plunge of the cylinder on the inclination of the axis of the cone formed by the edges (Archibald, et al., 1999).
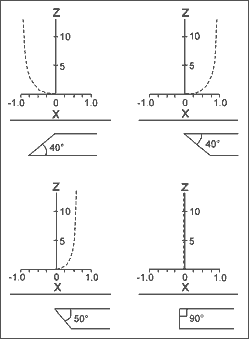
Fig. 3. Plots of wavelet transform maxima over synthetic fault geometries of variable dip (infinite slab model). The z-axis represents the scale of the edges (or degree of upward continuation), whilst the x-axis is an arbitrary scale showing the position of the edges relative to the fault contact. With increasing scale, the edges move in the downdip direction. Note that the degree of movement of the edges is also dependent on the dip angle of the fault, which allows delineation of relative dip angles (Archibald, et al., 1999).
RESULTS: 3D INFORMATION DERIVED FROM MULTISCALE EDGE ANALYSES OF SYNTHETIC MODELS
The interpretation of multiscale wavelet analyses has been furthered using an atlas of simplified synthetic geological features. This atlas consists broadly of single units comprising a different density (or magnetic susceptibilty) than the surrounding mass.
The analyses of magnetics data require a pseudo-gravity transform to reduce the effects of polarity. It is therefore only necessary to perform synthetic examples on gravity models, because a synthetic magnetics model with a pseudo-gravity transform is identical to a gravity model of similar geometry and contrasting relative properties.
Figures 5, 6, 7, and 8 display examples of different synthetic models. The 3D form surfaces of the potential field are colour mapped to show relative intensity of the underlying bodies. The 3D pixel sheets above the form surface display the multiscale edges with an increasing upward continuation with height. The relative wavelet amplitudes are colour mapped from blue to red with increasing values. The subtleties in the topology of the potential field form surface are not sufficient for most interpreters to tell the difference in the topology of the underlying unit. However, with the use of multiscale wavelet analyses the overall geometry can be defined. The relative decay of wavelet amplitudes with upward continuation contain information about the depth of the centre of gravity of the subsurface body. The dip of the worm sheets in the first few upward continuations, prior to the peak in wavelet intensity contains information of the geometry of the underlying body. Both maxima and minima are calculated. The maxima are most important when visually locating the edges of various features whereas the minima are used to calculate any change in the centre of gravity of the object with increasing upward continuation.
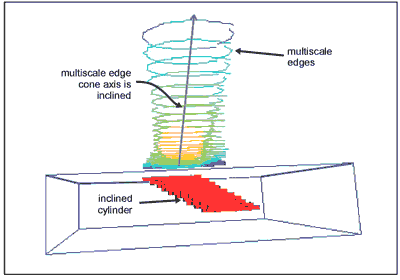
Fig. 4. 3D visualisation of the multiscale edges due to an inclined cylinder. The edges are plotted with increasing scale upwards.
Figure 5 displays three examples of synthetic plug-like or conelike bodies designed to represent pluton intrusion types. The worm sheets in Figure 5a are vertical prior to the achievement of the maximum wavelet amplitude, whereas Figure 5b are dipping outward, and Figure 5c are dipping inwards. These dip directions are a mirror image in a horizontal plane of the dip directions of the contacts of the underlying bodies with Figure 5a being a vertical column; Figure 5b being a finite truncated cone and Figure 5c representing an infinite outward diverging cone. The rate of decay of the wavelet amplitude with upward continuation is relatively shallower in the finite truncated cone (Figure 5b) than the two infinite examples (Figs 5a & 5c).
Figure 6 displays three examples of a single dipping contact between a body of high density and a low density medium. In Figure 6a the contact is vertical, as is the worm sheet. In Figure 6b, the contact is dipping to the right and the footwall side contains the higher relative density whereas in Figure 6c the contact has the same relative dip but the hanging wall side contains the higher relative density. In the latter two cases (Figs 6a & 6b) the dip direction of the worm sheet mirrors the direction of true dip beneath the surface. This phenomena is independent of whether the footwall or hangingwall unit has the high relative density. The colours of the sheets will change depending on the relative densities.
Figure 7 displays three examples of dykes dipping at various angles. In coupled edge models there is a minima as well as maxima. The worm sheets are displayed and labelled accordingly. These models were processed independently and there is no interference between the three dykes. In Figure 7a the dyke is vertical and the sheets diverge symmetrically with increasing upward continuation. In Figure 7b the dyke is dipping 60o to the right whereas in Figure 7c the dyke is dipping 30o to the right. The key observations from this series of models are that the dip direction of the minima is a mirror image of the dip direction of underlying body. Absolute dip of the minima is proportional to the absolute dip of the underlying model. Also the hangingwall side maxima do not reach a peak wavelet intensity compared with footwall side providing further information on the asymmetry of the model.
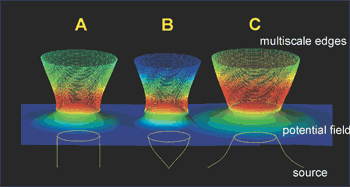
Fig. 5. Synthetic spherical / plug intrusions with subsurface topology (yellow), potential field response (colour mapped surface) and multiscale edges with increasing scale upwards (coloured points). (a) Infinite vertical column. (b) Finite truncated parabolic cone. (c) Infinite outward diverging cone.
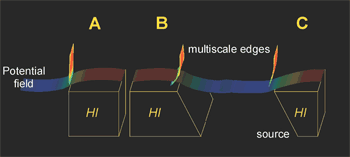
Fig. 6. Synthetic dipping contacts on high density body with subsurface topology (yellow), potential field response (colour mapped surface) and multiscale edges with increasing scale upwards (coloured points). (a) vertical contact. (b) Contact dipping to the right with footwall high density. (c) Contact dipping to the right with hanging wall high density.
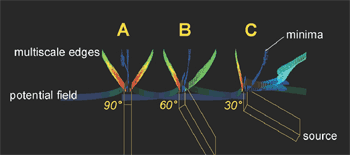
Fig. 7. Synthetic dipping dykes with subsurface topology (yellow), potential field response (colour mapped surface) and multiscale edges with increasing scale upwards (coloured points). (a) Vertical dyke. (b) Dyke dipping 60o to the right. (c) Dyke dipping 30o to the right.
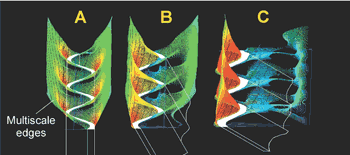
Fig. 8. Synthetic plunging folds with subsurface topology, top of fold surface (white), and multiscale edges with increasing scale upwards (coloured points). (a) Sine fold with vertical axial plane and vertical axes. (b) Sine fold with vertical axial plane and axes plunging 60o to the right. (c) Sine fold with vertical axial plane and axes plunging 30o to the right.
The folds represented in Figure 8 are essentially single folded dykes. They have many similarities with the straight dyke examples presented in Figure 7 with the added complexity of an uneven distribution of dense material between fold axis and limbs. Figure 8a represents a folded dyke with a vertically plunging fold axes and a vertical axial plane. Although the dyke is of constant true thickness and density, fold geometry causes an increased gathering of denser material at the hinges relative to the limbs. It is for this reason that a relative increase in the wavelet amplitude of the worms is achieved at the fold hinges. The overall symmetry orthogonal to the axial plane indicates, however, that the fold in Figure 8a is vertically plunging. Figures 8b and 8c show the multiscale edges from shallower plunging folds with the hanging wall side displaying shallower relative dip directions. Figure 8b shows a marked asymmetry between the two sets of edges. In Figure 8c the plunge of the fold is very shallow and as a result there is an extreme asymmetry between the right and left (hangwall and footwall) set of edges.
CONCLUSIONS
The use of the wavelet response to synthetic topology has enabled a greater understanding of how multiscale wavelet analysis can determine the true form and geometry of buried geological bodies. The processing of the NoddyTM Atlas of Structural Geophysics has provided a large number of synthetic cases to illustrate to interpreters how the effect of changes in geometry are reflected in wavelet analysis.
Derivation of depth of discrete bodies such as cylindrical, conical or plug-like intrusions is achieved by picking the peak intensity of wavelet amplitude in the successive levels of upward continuation.
Assymetry of wavelet maxima and dip direction of wavelet minima in coupled edges such as dykes provides information of the dip direction of the subsurface features. Dip direction of sheets of maxima in single edges such a contacts also provide an accurate estimation of true dip direction.
ACKNOWLEDGEMENTS
This paper is submitted with permission of the Director of the Australian Geodynamics Cooperative Research Centre. Ian Neilson is thanked for his patience and help in the high resolution re-calculation of the atlas models. Daniel Paull, Robert Woodcock and June Hill are thanked for processing the synthetic images for edge analyses. Neville Panizza is thanked for drafting of illustrations. Bill Power is thanked for review of drafts of the paper.
REFERENCES
- Archibald, N. J., Gow, P. and Boschetti, F., 1999, Multiscale edge analysis of potential field data: Expl. Geophys., 30, 38-44.
- Boschetti, F., Hornby, P. and Horowitz, F., 2000, Developments in the analysis of potential field data via multi-scale edge representation. In press Expl. Geophys.
- Boschetti, F., Moresi, L. and Covil, K., 1999, Interactive Inversion in Geological Applications: KES99, International Conference on Knowledge-based Intelligent Information Engineering Systems, Adelaide, 1999.
- Hornby. P., Boschetti, F. and Horowitz, F., 1999, Analysis of potential field data in the wavelet domain: Geophys. J. Internat, 137, 175-196.
- Hjelt, S.E., 1972, Magnetostatic anomalies of dipping prisms: Geoexploration, 10, 239-246.
- Hjelt, S.E., 1974, The gravity anomaly of a dipping prism: Geoexploration, 12, 29-39.
- Jessell, M.W., 1981, Noddy: an interactive map creation package. Unpublished MSc Thesis, University of London.
- Jessell, M.W., 1997a, An atlas of the potential-field response of geological structures. Preview, 66, 70.
- Jessell, M.W., 1997b, Atlas of Structural Geophysics. AGCRC Technical Publication 59.
- Jessell, M.W., 1999, Three-dimensional geological modelling of potential-field data In press: Comput. and Geosci.
- Jessell, M.W. and Valenta, R.K., 1996, Structural Geophysics: Integrated structural and geophysical mapping, in DePaor, D.G., Ed., Structural Geology and Personal Computers: Elsevier Science Ltd, 303-324.
- Mallat, S. and Zhong., 1992, Characterisation of signals from multiscale edges: IEEE Trans. On Pattern Recognition and Machine Intelligence, 14, 710-32.