Multifractal analysis of seismic data for delineating reservoir fluids
*Maryam Mahsal Khan, *Ahmad Fadzil M.H., **M Firdaus A. H., **Ahmad Riza G.
*Universiti Teknologi PETRONAS, 31750 Tronoh, Perak, Malaysia
**PETRONAS Research Centre, 43000 Kajang, Selangor, Malaysia
fadzmo@petronas.com.my
ABSTRACT
Oil and gas is at present the most important energy fuel in the world. Consumption of these resources has reached huge dimensions forcing companies to explore more and more potential sources of hydrocarbon reservoir. The established approaches for predicting reservoir fluids can be time-consuming and inaccurate. This paper describes the application of multifractal analysis on seismograms for delineation of reservoir fluids. Preliminary results show that the multifractal analysis on seismograms is able to delineate the reservoir fluids effectively. The sets of holder exponents and the singularity spectrum show that each reservoir fluid exhibits a unique value of singularity strength and spectrum. Effective delineation is an important step that will improve performance of oil and gas industry by reducing drilling uncertainties. More accurate seismic data processing and interpretation will help reservoir engineers to make a better decision concerning production plans.
KEYWORDS:
Multifractals, holder exponents, fractal dimensions, singularity spectrum, reservoir fluid delineation
1. Introduction
Seismic &mdash one of the extensively exploited hydrocarbon exploration tools takes advantage of the elastic properties of the formations. It is acquired by reflection of sound waves from underground strata and is processed to yield an image of the sub-surface geology of an area [1]. Seismic surveys are the fastest and cheapest technique covering a large subsurface area. Before drilling, a seismic survey is performed and the data collected is interpreted. Accurate seismic data interpretation yields correct drilling location hence saving a lot of time and money. Moreover accurate seismic analysis and interpretation will help reservoir engineers to make a better decision concerning production plans.
Seismograms spectral content vary significantly with time hence are considered non-stationary and require nonstandard methods of decomposition. The development of the wavelet theory in the 1990s has enabled a suite of applications in various fields of data analysis including the petroleum industry. Hence Wavelet Transform offer opportunities for improved processing algorithms and spectral interpretation methods e.g. computing the instantaneous frequency and phase attributes of complex traces along the seismogram to describe changes in spectral behavior Hence Wavelet Transform is best suited for seismic analysis. [2, 3, 4, 5]
The current approach to detect the reservoir fluids is by analyzing various well logs. Newer and direct ways of detecting reservoir fluids are being investigated. Reservoir modeling for fluid flow of an aquifer is recently achieved via statistical parameters like correlation length and fractal dimension from seismic data using variograms and power spectra. Applying similar techniques may also prove valuable for reservoir exploitation in the petroleum industry [6].
Seismic model studies indicate that the singularity spectrum obtained from spectral decomposition is sensitive to changes in lithology and pore fluid types and therefore can be used to estimate reservoir properties. Distinguishing oil from residual gas is still an unsolved problem (as shown in figure 2) [7]. Figure 1b shows the wavelet transform of a seismic trace displayed in Figure 1a. The singularity spectrum of the marked loops is shown in Figure 1c. Figures 2a-2d shows the cross plots of the various spectral attributes derived from the synthetic seismograms generated from models studies. A look at these Figures shows clusters corresponding to different lithology and fluid type. The separation between residual gas and oil sands, however, is marginal at all scales. [7]
Hence proper tools are required to delineate the various reservoir fluids. This paper describes the use of wavelet transform to extract all the relevant fractal properties from a seismic trace. The paper also discusses the application of multifractal analysis on seismic traces to delineate reservoir fluids for reservoir modeling.
2. Multifractal Analysis
Multifractal signals are signals whose regularity changes abruptly from one point to the next. These signals often have a self-similar structure at different level of resolution and also reveal details at arbitrary small scales. Various methods are applied for multifractal analysis e.g., the moment method, Wavelet Transform Modulus Maxima method, Gradient Modulus Wavelet Projection (GMWP) method, Gradient Histogram (GH) method [11, 12].
Multifractal analysis has been used in a wide range of applications like heart diagnosis, earthquake energy distribution, gene analysis, human retinal vessels, blood flow etc. [8, 9, 10]. Wavelet transform is the best suitable technique for locating the various singularities in a signal because of its time-frequency localization property and hence used in the above applications.
In order to measure multi-fractility of any signal the following attributes are computed.
Holder Exponents: It is the local measure of a signal. The smoothness of a distribution or measure is characterized by its holder exponent i.e. it quantifies the strength f transitions or singularities present in a signal. Wavelet transform is best suited for quantifying and computing holder exponents. The Wavelet transform Modulus Maxima Line Approach is used in order to compute the Holder Exponents. The slope of the modulus line gives the value of holder exponents [11, 13, 17].
Singularity Spectrum: It is the global measure of a signal which not only captures the hierarchy of singularities present but also computes the set of fractal dimensions of the signal. In order to measure any object we cover the object with d-dimensional boxes with size e. For fractal object the d dimension is always fractional and hence called fractal dimension. Wavelet Transform Modulus Maxima approach is used to compute the singularity spectrum [11, 12, 13, 17].
The purpose of this research is to apply wavelet analysis to reveal the different multifractal attributes of seismic sections for reservoir fluid delineation. In the multifractal analysis, we applied the wavelet transform modulus maxima (WTMM) on seismograms sections to obtain the singularity spectra of reservoir fluids. The behaviour of singularity spectra is investigated
3. Methodology
In this work, the multifractal analysis is applied on synthetic seismograms generated from earth models and well logs.
3.1 Earth Model Seismograms
Initially, seismograms of several simple earth models (shale-oil, shale-gas, shale-water, shale-gas-oil, shale-gas-water, shale-oil-water) are developed to obtain the singularity spectra using the multifractal approach. Realistic earth models (oil, gas, gas-oil, gaswater) are then developed based on available well logs.
These seismograms are generated using MATLAB [16] software at a sample rate of 2msec with the Ricker wavelet having a dominant frequency of 40Hz. Known density and velocity values of the reservoir fluids are used. The thicknesses of the layers are based on well data. The different seismograms of the earth model are analyzed and the respective singularity spectra are measured and recorded using FracLab [14] software.
3.2 Well Log Seismograms:
Due to the unavailability of seismic data, well log generated seismograms which are closed approximates of actual seismic data are used. In this study, well logs (specifically the sonic and the density logs) of five different wells (known to have gas, oil, gas-oil and gaswater reservoir fluids) are used to generate seismograms at a sample rate of 2msec and with a Ricker wavelet of 40 Hz dominant frequency and Trapezoid wavelet with passband range 8-14-40-60 Hz via SyntoolTM [15] software. The seismic sections containing the reservoir fluids are analyzed and the respective singularity spectra are similarly measured and recorded.
4. Results and Discussion
The singularity spectra of the simple and realistic earth model seismograms are shown in Figure 3. It can be seen from Figure 3(a) that reservoir fluids have different singularity spectra. The singularity spectrum serves as a possible parameter for delineation.
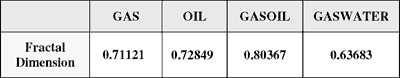
Figure 3(b) shows gas-oil reservoir having a narrowest spectrum and gas-water having the widest spectrum as compared to the rest of the reservoir fluids. The fractal (box) dimension is the maximum value in f(α) spectrum which is different for all the reservoir combinations with gas-oil having the highest value as shown in Table 1.
The singularity spectra of the well log seismograms are shown in Figure 4. It is seen that the spectra are shifted to the left. The spectra show gas-oil reservoir has a narrowest spectrum and gas-water has the widest spectrum as compared to the rest of the available reservoir fluids (gas, oil, gas-oil, gas-water). The fractal (box) dimensions are different for all the reservoir fluid combination with gas-oil having the highest value as shown in Table 2.
The singularity spectra obtained from the realistic earth model seismograms and well log seismograms are seen to distinguish the reservoir fluids. The positions of the spectra however do not have any consistent ordering when compared between earth and well log models. This is because for the earth model seismograms, fixed density and velocity values are used whilst for the well log seismograms, the density and velocity values are not fixed but they vary along the depth.
The left-shifted singularity spectra of well log seismograms is due to more irregularities (lower values of holder exponents) encountered as compared to the earth model seismogram.
It is also observed that generally the width of the spectrum tends to be inversely proportional to the thickness of the seismic sections analysed. Here, the thicker sections have more layers which contributed to more singularities.
Conclusion
The paper presents the findings of the multifractal analysis on seismograms for the delineation of reservoir fluids. Preliminary results show that the multifractal analysis on seismograms is able to delineate the reservoir fluids effectively. The sets of holder exponents and the singularity spectra obtained from earth model and well log seismograms show that each reservoir fluid exhibits a unique value of singularity strength and spectrum.
The location and range of holder exponents, a, vary for different reservoir fluids. It is clearly shown that for gas-oil the singularity spectrum is narrowest whilst for gas-water the spectrum is widest. The shape (width and height) of the spectra relates to the time interval analysis of seismic section.
Further studies will focus on effects of reservoir fluids on the fractal dimension. The multifractal analysis shall also be tested on real seismic data.
Effective delineation using seismic data is an important step that will improve performance of oil and gas industry by more effective well placement, reducing drilling uncertainties and accurate seismic volume analysis and interpretation.
Acknowledgments
We would like to thank our collaborators in Petronas Research Centre for their inputs in modeling and the use of their facilities. For the computations made in this research, we acknowledge the use of Fraclab 2.03 by INRIA and SyntoolTM by Landmark for synthetic seismogram generation.
References
- [1] R McQuillin M Bacon W Barclay, An introduction to seismic interpretation, Graham & Trotman Limited, 1979.
- [2] Avijit Chakraborty and David Okaya, "Frequency time decomposition of seismic data using wavelet based methods", SEG Geophysics, Nov 1995
- [3] John P. Castagna,, Shengjie Sun, “Comparison of spectral decomposition methods”, First Break, March 2006
- [4] L.Guan, Y.Du , L.Li, "Wavelets in Petroleum Industry: Past, Present and Future", SPE 89952 , 2004
- [5] Praveen Kumar, Efi Foufoula-Georgiou, polis-St. Paul "Wavelet Analysis For Geophysical Applications", American Geophysical Union , 1997
- [6] Ken Mela, Joh N.Louie, "Correlation length and fractal dimension interpretation from seismic data using variograms and power spectra", SEG, 2001
- [7] K.R Sandhya Devi, TX A.J, "Wavelet Transforms and Hybrid Neural nets for improved pore fluid prediction and reservoir properties estimation", SEG , 2004
- [8] Tatijana Stosic, Borko D.Stosic, "Multifractal analysis of human retinal vessels", IEEE Transaction, August 2006
- [9] B.Enescu, K.Ito, Z.R.struzik, "Wavelet Based Multifractal analysis of real and simulated time series of earthquakes", Annuals of Disas.Prev.Res.Inst.,Kyoto Univ., No.47 B , 2004
- [10] R.L. Westra, "The Analysis of Fractal Geometry using the Wavelet Transform With Application to Gene Expression Analysis" &mdash Proceeding of EUNITEconference, Albufeira (Portugal), 19-21 September 2002.
- [11] Multifractal tutorial http://www.physionet.org/tutorials/multifractal/index.shtml
- [12] Antonio Turiel, Conrad J. P?erez-Vicente, Jacopo Grazzini, "Numerical methods for the estimation of multifractal singularity spectra on sampled data: a comparative study", Elsevier Science , March 13th, 2005
- [13] J.J.Staal, "Characterizing The Irregularity Of Measurements By Means Of The Wavelet Transform", Delft University of Technology , 1995
- [14] Fraclab 2.03 &mdash A Fractal Analysis Software by INRIA &mdash http://fractales.inria.fr/
- [15] SyntoolTM by Landmark &mdash http://www.lgc.com/Landmark/integrated+solutions/geophysicaltechnologies/syntoo/index.htm
- [16] MATLAB® &mdash http://www.mathworks.com/
- [17] Mallat S. and Hwang W.L, "Singularity detection and processing with wavelets", IEEE Transaction on Information theory, 1992
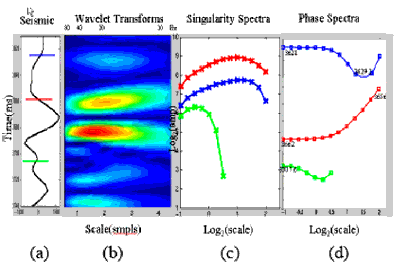
Figure 1: Wavelet transform and the singularity spectra
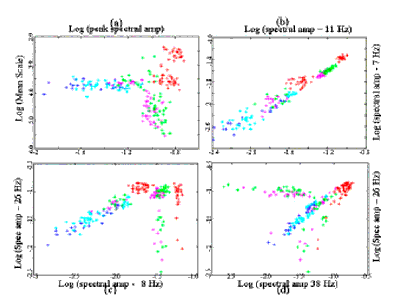
Figure 2: Scatter plots of scale spectral attributes; red &mdash gas; greenoil; blue &mdash wet; magenta &mdash residual gas; cyan &mdash residual oil;
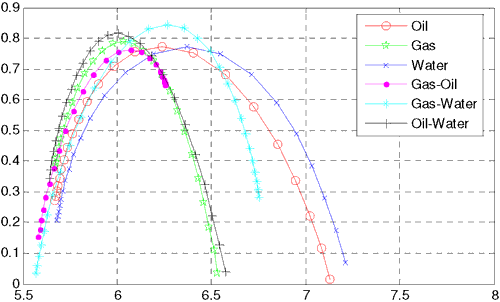
Figure 3(a): Singularity spectrum of oil (red), gas(green), water(blue), gas-water(cyan), gas-oil (magenta), oil-water (magenta) of Simple Earth Model Seismograms
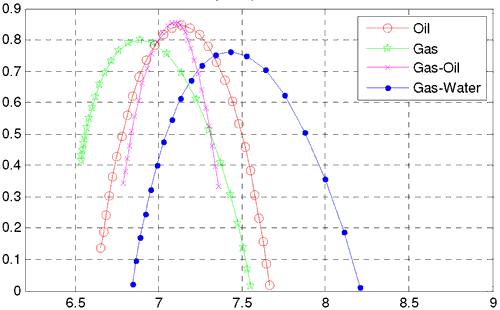
Figure 3(b): Singularity spectrum of oil (red), gaswater(blue), gasoil(magenta), gas(green) of realistic Earth Model Seismograms
Table 1: Fractal Dimension of Earth Modeled seismograms
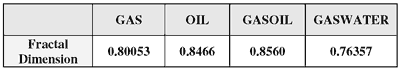
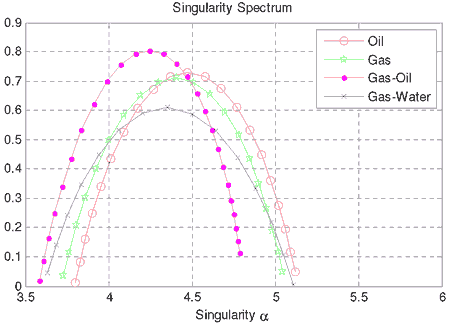
Figure 4: Singularity spectrum of oil (red), Gas(green), Gas-Oil(magenta), Gas-Water(blue) of Well Logs Seismograms
Table 2: Fractal Dimension of Well Log seismograms