Total Cost of Ownership Analysis (TCO) / Cost of Ownership (COO)
Sourse: http://www/solutionmatrix.com/total-cost-of-ownership.html
A Cost of Ownership analysis (or Total Cost of Ownership, TCO Analysis), is a business case designed especially to find the lifetime costs of acquiring, operating, and changing something. TCO analysis often shows there can be a large difference between the price of something and its long term cost.
Those who purchase or manage computing systems have had a high interest in TCO since the 1980s, when the potentially large difference between IT cost and IT purchase price started drawing the attention of IT vendor marketing (largely from competitors of IBM). The five year cost of ownership for major computing systems can be five to eight times the hardware and software acquisition costs.
Today, TCO analysis is used to support acquisition and planning decisions for a wide range of assets that bring significant maintenance or operating costs across a long usable life. Total cost of ownership is used to support decisions involving computing systems, vehicles, buildings, laboratory equipment, medical equipment, factory machines, and private aircraft, for instance. Today, TCO analysis for these kinds of assets is a central concern in
- Budgeting and planning
- Asset life cycle management
- Prioritizing capital acquisition proposals
- Vendor selection
- Lease vs. buy decisions
TCO Analysis Calls for Judgment
Simply naming the cost of ownership subject does not fix the boundaries for the analysis. You must still decide and communicate which costs belong in the analysis and why. Consider the case when TCO Analysis is applied to potential IT system acquisitions:
- IT TCO comparisons from publishing analysts tend to focus more narrowly on purchase price, maintenance, and very direct operational costs (here the emphasis is on "Apples-to-Apples" comparability between different vendor solutions).
- IT TCO analyses from sales people, consultants, or managers for specific settings tend to have a broader scope, aiming at a larger, more inclusive total lifetime cost (here the emphasis is on predicting budget impacts accurately and, sometimes, on comparing the total costs for quite different kinds of proposed actions). In each of these situations, the TCO analysis serves a different purpose, and each calls for its own TCO cost model (see next section). When using TCO results, remember that analyst judgment plays a role in the choice of which cost categories belong in the case and which do not, and which cost categories best serve the purpose of decision makers and planners. When the TCO Analysis compares different scenarios or action plans, be sure to verify that all were evaluated with the same cost model.
The TCO Model: Centerpiece of the Analysis
Good TCO analysis brings out the "hidden" or non-obvious ownership costs that might otherwise be overlooked in making purchase decisions or planning budgets.
The TCO analysis begins with the design of a comprehensive cost model that completely covers the subject of the case, and which supports the purpose and needs of decision makers. The cost model, as presented here, is simply a two-dimensional matrix, whose cells represent cost categories. Here, for example is a model for TCO analysis of a proposed IT system acquisition.
| Acquisition Costs | Operating Costs | Change Costs | |
| Software | |||
| Hardware | |||
| Personnel | |||
| NW & Comm | |||
| Facilities |
Note that the vertical axis represents IT resource categories, and the horizontal axis represents IT life cycle stages. The model's design is successful if
- each axis covers the complete set of categories for that dimension that are useful to decision makers and planners, and
- the cost categories will capture the obvious costs but also the less-obvious, or "hidden" costs.
The two axes, that is, should convey self-evident completeness. If they do, there should be no unpleasant cost "surprises" appearing during implementation, and the analyst should not have to answer questions such as: "Why didn't you include this? Or that? As the example below shows, it is the choice of cost categories for each axis that gives the model its power as an analysis tool and as a communication tool.
The analysis continues by adding the names of resources to each cell. Resource items that go together in a cell should be those that are planned and managed together, and which may have common cost drivers. For a planned IT System acquisition, two of the model's cells might hold these resource names:
|
Acquisition / Hardware Costs 2st row, 1st column |
Operating Costs / Personnel 3rd row, 2nd column |
|
• Server system purchase • PC system purchase • Engineering WS system purchase • Storage space purchase • Other peripheral HW |
• Administrative labor – Systems operators – Systems programmers – Applications programmers – Network admin labor – Storage management – IT management – Other Admin • Trouble shooting labor • Continuing contract labor • Continuing training (professional) |
Other cells in the same model are similarly populated with resources. The full model provides an effective tool for assuring business case builders and case recipients that every important cost item is included and that everything irrelevant is excluded. As the following sections show, it also provides a uniquely powerful tool for analyzing life cycle costs.
The cost model also provides a means for assuring all involved that different action scenarios were compared fairly. The model should be designed so that one model covers all relevant costs in all scenarios. Of course some items may have 0 values in one scenario and non zero values in others, but by applying one model with the same cost categories to all scenarios, there should be no question that the TCO comparison between scenarios is fair.
Cash Flow Cost Estimates
The cost model (above) provides the TCO analyst with a list of cost items—the contents of all the model cells. The analyst must then estimate cost figures for each item, for each scenario under consideration, for each year covered by the analysis
Here, for example, are one analyst's estimates for just one cost item (Server System Purchase):
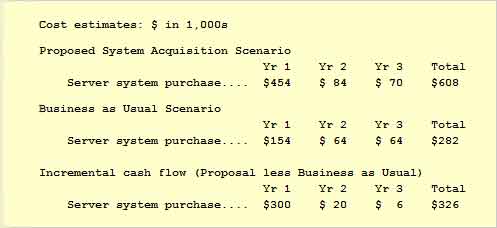
Methods for making these estimates are beyond the scope of this document, but briefly, the analyst will base these figures on several kinds of information. For the IT example, the analyst will forecast cost drivers for each item, under each scenario, (e.g., numbers of users, transaction volume, storage space requirements, and so on). The analyst will also base the estimates on vendor-provided information, experience with similar systems in other settings, and industry standards and guidelines.
With cost categories and cost items from the cost model, the analyst can build the primary analytic tools in the TCO study: cash flow statements for each scenario. The example below shows cash flow statement structure (many line items from the model are omitted from this example to show the structure more clearly).
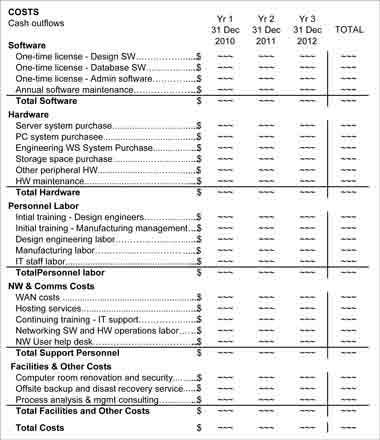
The cash flow statements are in a sense children of the cost model, in that the statements take their line items from the model and retain some of the model's structure. The cash flow statements have the parent cost model's vertical axis categories, but in the horizontal dimension, the statements present a time line covering the TCO analysis period. The task for the TCO analyst is to estimate cost figures for each year, for each item, for all scenarios.
Here, the analyst is considering two possible scenarios: (1) Proposed System Acquisition, and (2) Business as Usual. The Business as usual scenario is an important part of any TCO analysis. It recognizes that even if the company does not acquire the new system, it will still spend money on many of the same IT-related cost items. Only with a baseline, or Business as Usual scenario for comparison, can any cost savings or avoided costs be found and measured.
For this reason, the TCO analyst will also construct another scenario, (3) The Incremental Scenario, which shows the cost differences between corresponding line items on scenarios (1) and (2). All three cash flow scenarios, however, will have the same cash flow statement structure (as above) because they all derive from the same cost model. (For examples of complete cost model and cash flow scenarios, see either The Business Case Guide or Business Case Essentials. For a working spreadsheet implementation, see Financial Modeling Pro).
Finally, the TCO Analyst will use the "bottom lines" of the cash flow statements to compare scenarios using standard financial metrics, such as 3-year net cash flow, net present value, total capital costs (CAPEX), total operating expenses (OPEX) and, of course, 3-year total cost of ownership.
Moreover, if Proposal Scenario costs are lower in some areas than the corresponding Business as Usual Scenario costs, the Incremental cash flow statement will show cost savings in these areas. Cost savings can be treated as cash inflows, allowing the analyst to extend the analysis with investment-oriiented metrics such as return on investment, internal rate of return, and payback period. In that case, the TCO analysis might be summarized with an array of financial metrics that looks like this:
| 3-Year Figures in $1,000s | Proposed Acquisition | Business as Usual | Incremental Differences |
| Total Cost of Ownership | $14,256 | $17,258 | $(3,002) |
| Capital Costs & Expenses (CAPEX) | $1,219 | $707 | $511 |
| Operating Costs & Expenses (OPEX) | $13,037 | $16,550 | $(3,513) |
| Net Cash Flow | — | — | $2,981 |
| Net Present Value @8% (NPV) | — | — | $2,365 |
| Internal Rate of Return (IRR) | — | — | 121% |
| Simple Return on Investment (ROI) | — | — | 24.9% |
| Payback Period | — | — | 7 months |
The negative values in (shown in parentheses) indicate cost savings under the Proposal scenario relative to Business as Usual. Those who want to understand fully where these metrics come from will of course have to have access to the three cash flow statements.
The TCO results above seem to show a clear advantage for choosing the Proposal Scenario over Business as Usual. However, the TCO analyst's work is not yet completed. After reviewing the above, for instance, questions will arise such as this: If we choose to implement the Proposed System Acquisition ...
- Which cost areas represent the greatest risks, and therefore need to be managed most carefully?
- Which cost areas are most important in driving overall TCO results?
- What can we do to minimize costs?
The analyst can begin to answer such questions by returning to the cost model itself (next section).
Example TCO Analysis
Cost model categories for the cost model's rows and columns were chosen to represent cost areas that need careful planning and management during the three year period in view. Once the scenario cash flow estimates are made (previous section, above), the model's structure can now be exploited to show cost dynamics that may not be easy so easy to see in the cash flow statements.
Here, the cost model cells are filled with the 3-year totals for items in each cell. The figures that go into each sum, of course, come from the cash flow statements.
| $ in 1,000s | Acquisition Costs | Operating Costs | Change Costs | Total | % of TCO |
|---|---|---|---|---|---|
| Software | 444 | 121 | 220 | 785 | 5.5% |
| Hardware | 874 | 222 | 122 | 1,218 | 8.5% |
| Personnel | 188 | 5,699 | 3,925 | 9,812 | 68.8% |
| NW & Comm | 255 | 1,082 | 892 | 2,229 | 15.6% |
| Facilities | 60 | 46 | 106 | 212 | 1.5% |
| Total | 1,821 | 7,170 | 5,264 | 14,256 | — |
| % of TCO | 12.8% | 50.3% | 36.9% | — | 100.0% |
| $ in 1,000s | Acquisition Costs | Operating Costs | Change Costs | Total | % of TCO |
|---|---|---|---|---|---|
| Software | 274 | 82 | 138 | 494 | 2.9% |
| Hardware | 539 | 97 | 71 | 707 | 4.1% |
| Personnel | 55 | 8,873 | 5,952 | 14,879 | 86.2% |
| NW & Comm | 146 | 543 | 459 | 1,149 | 6.7% |
| Facilities | 0 | 15 | 15 | 29 | 0.2% |
| Total | 1,104 | 9,610 | 6,634 | 17,258 | — |
| % of TCO | 5.9% | 55.7% | 38.4% | 100.0% |
| $ in 1,000s | Acquisition Costs | Operating Costs | Change Costs |
|---|---|---|---|
| Software | 170 | 38 | 83 |
| Hardware | 335 | 125 | 51 |
| Personnel | 133 | (3174) | (2027) |
| NW & Comm | 109 | 539 | 432 |
| Facilities | 60 | 31 | 91 |
The analysis summarized in these three tables provides a wealth of useful information that management can put to good use, regardless of which scenario they choose to implement. The next section discusses just a few of the messages brought out by the cost model analysis.
What TCO Can Tell You
Some of the learning points from the TCO analysis above include the following:
- TCO can bring out so-called "hidden" costs of ownership.
In this example, management chose to include all the important costs caused by system acquisition, including the labor costs of people who use or support the systems.
When deciding whether or not to acquire a new system, it is easy to become distracted by hardware and software cost, but in fact the "People" costs that come with the system are 68.8% of the very large TCO. How well these people are trained, employed, and managed will be far more important in determining actual cost of ownership than other factors, such as the choice of HW or SW vendor. - TCO can put the spotlight on potential cost problems before they become problems.
In the IT world, for instance, "Change costs" are typically under planned and over budget (these are the costs of upgrading, adding capacity, reconfiguring, adding users, migrating to different platforms, and so on).
All of the change cost items from this model could have appeared under "Acquisition" or "Operating" cost columns, but by specifically culling out the change costs, and giving them a column of their own, they can be planned and controlled more easily. In this example, change costs represent between 35 and 40% of total cost of ownership in both scenarios. - Creation of an Incremental Cash Flow Statement Finds Cost Savings and Avoided Costs.
In this example, Proposal Scenario costs are larger than Business as Usual Costs in all cells of the cost model except two: Operational Costs for Personnel and Change Costs for Personnel. Here, however, the Proposal Cost Savings show up as very large negative numbers in the incremental cost model summary. Those two cost savings are more than enough to give the Proposal Scenario a large TCO advantage.
TCO Analysis is Blind to Business Benefits (Except Cost Savings, Sometimes)
TCO analysis is not a complete cost benefit analysis, however. TCO pays no attention to many kinds of business benefits that result from projects or initiatives, such as increased sales revenues, faster information access, improved competitiveness, or improved product quality. When TCO is the primary focus in decision support, it is assumed that such benefits are more or less the same for all decision options, and that management choices differ only in cost.
TCO may be used as shown above, however, to find the benefits cost savings and avoided costs. These benefits show up when TCO for one scenario is compared to TCO for another scenario. As in the example above, when TCO is less under a "Proposal" scenario than TCO under a "Business as Usual" scenario, the result is an expected cost savings under the proposal scenario.
For more examples showing how estimated costs produce estimated savings, and for further guidance on building the TCO cost model, see Business Case Essentials or The Business Case Guide.