DonNTU | Master's portal | RU | UA | EN
 Ekaterina Tsibulka
Faculty: Computers and Information Science (CIS)
Department: Automated Control Systems (ACS)
Speciality: “Specialized Computer Systems” (Specialization: “Computer Systems of Medical and Technical Diagnostics”)(CSD)
Theme of Master's Work: “The Development of Specialized Computer System for Diagnosing Diseases of the Gastrointestinal Tract by Images of Fibrogastroscopy”
Scientific Supervisor: Ph.D. (in Engineering), Associate Professor of the department ACS Ekaterina Merkulova
Autobiography | Abstract
Master's Work Abstract
“The Development of Specialized Computer System for Diagnosing Diseases of the Gastrointestinal Tract by Images of Fibrogastroscopy”
Introduction, actuality
In the sphere of gastroenterology the most widespread diagnostic technique is esophagogastroduodenoscopy. It is practically known that this procedure is not just the safest, but the most effective and showing the best results in the given sphere of research.
During the given research a doctor aims at carrying out the procedure speedily as it is accompanied by the patient’s having unpleasant feelings. During short time (2-5 min) a doctor must not only examine thoroughly the walls of the examined organ but also take the decision about carrying out of possible manipulations. Thereby, creating the computer diagnostic system for gastrointestinal diseases which would also process the pictures of the similar research for pathologies is an actual problem. Such system will allow scaling down the research time comparing to visual estimation and minimize the possibility of mistake, connected with human factor.
Objectives and goals
The test subject of the given work is the picture of the stomach surface, got in the result of esophagogastroduodenoscopy.
The main demands to the computer system of processing these pictures is the accuracy in defining pathology, the work speed, adaptability to working different types of defects.
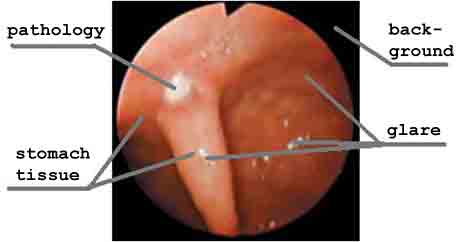
Figure 1 — Initial picture got during esophagogastroduodenoscopy.
The research task can be formulated in the following way:
- Segment the picture.
- Differentiate the segments to relating to the background, stomach tissue, and pathology.
- Define the signs of the areas identified as relating to pathology.
- By visual signs define the type of pathology.
Scientific novelty
The scientific novelty of the research consists in:
- The choice of methods for processing pictures of esophagogastroduodenoscopy for diagnostics of human gastrointestinal tract
- Adapting the existing methods of processing esophagogastroduodenoscopy pictures for the concrete sphere of research – gastroenterology
- Development of the corresponding software
Survey of research and developments on the given topic
There is a system of processing medical pictures named optimed. This program is used for getting, processing and archiving information.
The source of data is a standard analogue video output of the endoscopic camera, videotape recorder, etc. and also digital camera, maintaining PTP protocol, any TWAIN-compatible scanner or camera.
The used standards of the video signal (PAL, SECAM, and NTSC) and the type of input signal (VHS, S-VHS) are defined by the performance capabilities of the used video card. The program works with any card of video-capturing and cameras having drivers WDM for Windows and also cameras of DV standard.
The newest digital endoscopic system Pentax EPK-1000 with the video processor allows the real-tome processing the data-flow video got by the endoscope, analyzing and saving processing results on the PC with the possibility of the record on the digital carriers, for example CD.
Programming complex U-PACS allows gathering, keeping and processing the data of endoscopic research.
The Medical Vision computer system is used in the medical practice for automation the endoscopic section work. The system is connected to the standard video output of the endoscopic camera. The endoscopist can save necessary pictures. Saved pictures get into the computer and further may be processed, kept in the database; also search, view and editing, inserting the report about the research done and printing may be fulfilled.
There is also a possibility to video record the whole endoscopic research to the computer hard disk with further recording of the given film to CD or DVD.
In contrast to the existing developments given above the the developing system will have the possibility not just of video capturing and its processing in order to raise the quality, but also to mark possible pathologies on the picture.
Scientific novelty consists in the development of the complex of methods of work with the pictures for the definite medicine area – gastroenterology, in order to help the doctor in defining the disease.
Approbation
The results of work were reported on the I Ukrainian technological conference of the students, postgraduates and young scientists “Informational controlling systems and computer monitoring” and published in the corresponding collection (volume 2, section 5 – Digital processing of signals and pictures).
Current and planned results
The analysis of FGSD pictures shows that the brightness of point of pathologies differs sharply from the brightness of background points and defining of the threshold is not a problem. In practice it is not so easy, as the examined picture is subjected to noise influence and some dispersion of the brightness values is possible. Some analytical approaches to the threshold limiting for brightness exists. One of the methods consists in the establishment of the threshold on the level with which the whole sum of the elements with under-threshold brightness is coordinated with the a priori possibilities of these brightness values.
The easiest type of segmentation is the threshold segmentation. But to use this method it is necessary to know that picture consists of one object and background, the brightness of which is in strictly established ranges and do not cross, which is not typical for the pictures got as the result of esophagogastroduodenoscopy.
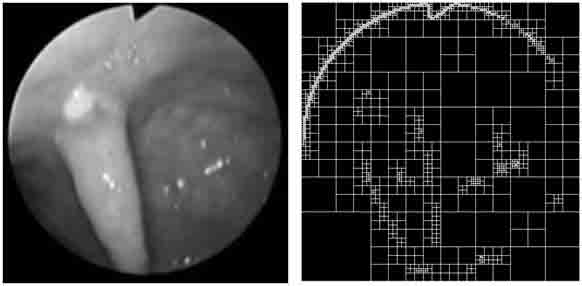
Figure 2 — Application of the segmentation algorithm with the help of cuardo-trees.
Left - initial picture, right - segmented one.
It is evident that in this approach the biggest differentials of brightness int he picture are distinguished, which on our type of shots corresponds not to pathologies, but to the borders of the picture and the background.
More in details was considered the relatively new method of picture segmentation – the method of marker divide. The essence of it is in considering picture as some map of the place, where brightness values represent the values of the heights related to some level. If filled with water, this place will make pools. If water is added the pools will merge. The places of the pools’ merging are marked as watershed lines.
Thereby, it is necessary to define the “drained” pools and “watershed lines” on the picture by processing the local areas depending on their brightness.
The marker divide method is one of the most effective kinds of picture segmentation. When realizing this method other main procedures are fulfilled:
- The segmentation function is calculated. It concerns pictures where objects placed in the dark areas and are difficult to distinguish.
- Calculating markers of the front plan of pictures. They are calculated on the basis of the analysis of pixel coherency of every object.
- Calculating of background markers. They represent pixels which are not parts of objects.
- Modification of the function of segmentation on the basis of the meaning of background and front plan markers’ disposition.
- Calculation on the basis of the modified function of segmentation.
where * is 2-D operation of compression,
A – initial picture,
![]() и
и ![]() - two pictures, where every point contains approximate derivatives by x and y.
- two pictures, where every point contains approximate derivatives by x and y.
For every point of the picture the approximate value of gradient size may be calculated using the received approximate values of the derivatives:
![]()
Further, having calculated the gradient values the watershed method was applied, which gave the following result:
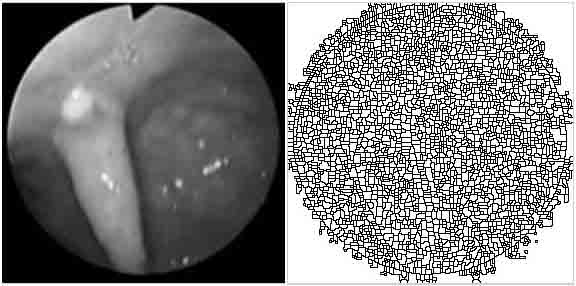
Figure 3 — Application of the watershed method with the use of picture gradient (Sobel operator).
Left – initial picture, right – segmented picture.
As seen from the result, segmentation is very shallow and the additional pre-processing of the picture is required for more effective use of the method.
For marking the front plan objects different variants of morphological technologies were used, suggested by Matlab, exactly – opening through restoration and closing through restoration. Further It is necessary to get rid of separate isolated pixels in the picture. The results are presented in the figure 4.
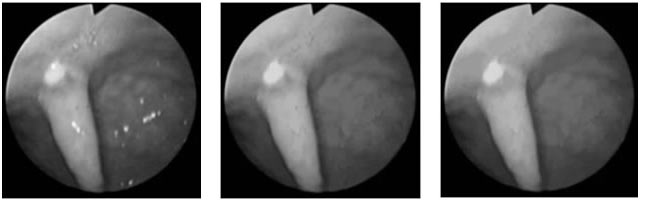
Figure 4 — Application of morphological technologies of opening and closing through restoration.
From left to right: initial picture, morphological opening, morphological closing.
Analyzing the results, we’ll admit that application of these methods gave the possibility to get rid of patches of light and of making borders of the sought-for object smoother.
Next, having calculated local maximums, we will get front plan markers. To calculate background markers it is enough to start the operation of threshold processing [3]:
where![]() - pixel of the picture,
- pixel of the picture,
k – the level of grey, by which the picture is transferred intro black-and-white.
For precise defining of local maximums of the picture we will do the transformation of brightness with the use of the morphological restoration method, so that all local maximums of the picture got after threshold processing would be different from nought.
Having calculated the front plan markers, background markers and having transferred the picture according to the algorithm given above we can use the marker watershed method. The results of it are presented in the figure 5.
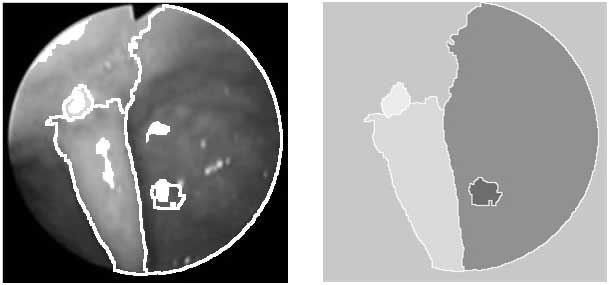
Figure 5 — Results of the use of modified algorithm of marker watershed.
Left – markers and borders of objects, left – the received segmented picture.
Thereby, the results of the experiments proved that the given method shows good results when used for pre-processing of images. The lightest area in the segmented picture (fig. 5.b) is the marked sought-for pathology. The quantity of segments in the picture without taking into account the background – 4, which means a significant improvement of segmentation quality comparing to the results presented in the figure 3 (without pre-calculations).
Figure 6 — Stages of pre-processing and segmentation of the picture.
(animation: volume – 120 Kb; size - 285x280; quantity of frames – 8;
delay between the frames – 100 ms; delay between the first and the last frame – 150 ms;
quantity of recycles – endless.)
It is planned to make additional modifications of watershed marker method which would give the possibility of adaptive processing of every input picture, and also it is planned to examine picture for other gastrointestinal tract pathologies (now – ulcer only). Creating of corresponding software is also planned.
Conclusion
According to the results of the experiments, the most effective method of segmentation is the modified method of marker watershed. But for its successful work the additional calculations are necessary, exactly – gaining markers of the front plan, background markers, and also it is required to modify the segmentation function on the basis of the received data.
References
- Павлидис Т. Алгоритмы машинной графики и обработки изображений. М. Радио и связь, 1986, 406 с.
- Прэтт У.К. Цифровая обработка изображений. – М.: Мир, 1982. Т.I.-2. 792 с.
- Сойфер В.А. Компьютерная обработка изображений. Часть 2. Методы и алгоритмы. – Соросовский образовательный журнал, №3, 1996.
- Сегментация методом управляемого водораздела [Electronic resource] / И.М.Журавель "Краткий курс теории обработки изображений" / - Access mode to article: http://matlab.exponenta.ru/imageprocess/book2/48.php
- Консультационный центр MATLAB, Раздел "Обработка сигналов и изображений\Image Processing Toolbox" [Electronic resource] - Access mode to article: http://rrc.dgu.ru/res/matlab/imageprocess/book3/index.html
- Проблема подавления шума на изображениях и видео и различные подходы к ее решению [Electronic resource] - Access mode to article: http://cgm.computergraphics.ru/content/view/74
- Методы сегментации изображений: автоматическая сегментация [Electronic resource] - Access mode to article: http://cgm.computergraphics.ru/content/view/147
- Компьютерное зрение [Electronic resource] - Access mode to article: http://ru.wikipedia.org/wiki/Компьютерное_зрение
- Пономаренко Л.А., Щелкунов В.И., Скляров А.Я. Инструментальные средства проектирования, имитационного моделирования и анализа компьютерных сетей: Учебное пособие. – К.: Наук. думка, 2002. - 508 с.
- Лекции по обработке изображений [Electronic resource] - Access mode to article: http://graphics.cs.msu.ru/courses/cg02b/lectures/lection5/sld019.htm
Note
The master’s work is not finished after writing this author’s abstract. The completion is in the December 2010. The full text of the work and the materials on the topic can be taken from the author or her instructor after the given date.