Source: http://www.cmis.csiro.au/rsm/intro/
Ěŕňĺđčŕëű đŕáîňű: Îá ŕâňîđĺ | Đĺôĺđŕň | Áčáëčîňĺęŕ
An introduction to remote sensing
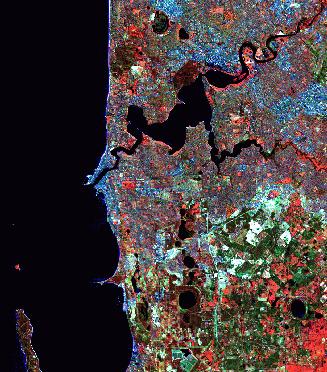
A satellite image of the Perth region is displayed above. The spatial patterns of the ocean and the Swan River will be familiar to most Western Australians. Lake Monger is near the top of the image and Garden Island is in the bottom left hand corner. The CBD and Fremantle appear in shades of light blue.
The information that follows in this section will help you understand how images like this are acquired, how the displays are created and can be interpreted and why they make such a useful dataset for land condition monitoring.
What is Remote Sensing?
Remote sensing is one of a suite of tools available to land managers that provides up-to-date, detailed information about land condition. Remote sensing uses instruments mounted on satellites or in planes to produce images or scenes of the Earth's surface.
Remotely sensed images can be used in many applications, for example for mineral exploration, monitoring ocean currents, land use planning, and monitoring the condition of forest and agricultural areas. The uniqueness of satellite remote sensing lies in its ability to show large land areas and to detect features at electromagnetic wavelengths which are not visible to the human eye. Data from satellite images can show larger areas than aerial survey data and, as a satellite regularly passes over the same plot of land capturing new data each time, changes in the land use and condition can be routinely monitored.
In the Land Monitor project, satellite images are being used to provide information on land condition and the changes in that condition through time, specifically salinity and the status of remnant vegetation, to help farmers, environmental managers and planners better manage the land. One of the outcomes of the Land Monitor project will be an archive of satellite images of the south-west agricultural region. To get additional information about land condition, the satellite images are combined with other data such as air photos, digital elevation maps (DEMs) and ground data.
Farmers, landcare workers and field officers, with their detailed knowledge of the vegetation and soils in their own paddocks or regions, can extract information on productivity from simple displays of the satellite images.
How Satellites Acquire Images
Satellite sensors record the intensity of electromagnetic radiation (sunlight) reflected from the earth at different wavelengths. Energy that is not reflected by an object is absorbed. Each object has its own unique spectrum, some of which are shown in the diagram below.
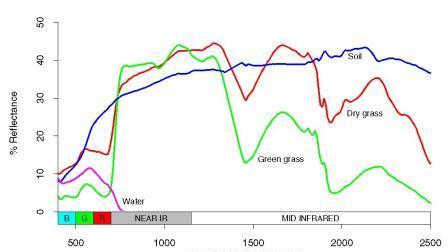
Remote sensing relies on the fact that particular features of the landscape such as bush, crop, salt-affected land and water reflect light differently in different wavelengths. Grass looks green, for example, because it reflects green light and absorbs other visible wavelengths. This can be seen as a peak in the green band in the reflectance spectrum for green grass above. The spectrum also shows that grass reflects even more strongly in the infrared part of the spectrum. While this can't be detected by the human eye, it can be detected by an infrared sensor.
Instruments mounted on satellites detect and record the energy that has been reflected. The detectors are sensitive to particular ranges of wavelengths, called bands. The satellite systems are characterised by the bands at which they measure the reflected energy. The Landsat TM satellite, which provides the data used in this project, has bands at the blue, green and red wavelengths in the visible part of the spectrum and at three bands in the near and mid infrared part of the spectrum and one band in the thermal infrared part of the spectrum. The satellite detectors measure the intensity of the reflected energy and record it as a number between 0 and 255.
Another feature that characterises each satellite system is its footprint or pixel size. This is the smallest area on the ground for which it can record the reflected energy. For every 30m by 30m plot of land, the Landsat TM scanner records a number for each of the seven bands, which is the average intensity of the reflected energy for the features in that plot of land.
The final feature that characterises a satellite system is the frequency with which it revisits a particular location. The Landsat TM satellite revisits each location every 16 days. The data for Australia are relayed to a receiving station at Alice Springs run by the Australian Centre for Remote Sensing (ACRES). Each image is routinely archived. Theoretically, a site could be viewed every 16 days to detect changes in land use or condition. In practice, some of these images are unusable because the satellite sensors cannot see through cloud. In general, for the Land Monitor project, one image is purchased each growing season. Spring images are used to map and monitor the agricultural lands and summer images are used to map and monitor the remnant vegetation.
The goal of image processing is to detect features, and changes in those features over time, and to be sure that what is seen is related to the ground cover rather than to interference caused by the atmosphere. To do this, sequences of images are aligned to each other and to standard map grids (registration and rectification) and are calibrated to remove the effects of atmospheric differences.
Interpreting Image Displays
The satellite images, as recorded by ACRES, consist of numbers which are measurements of the amount of energy that has been reflected from the earth's surface in different wavelength bands. Some of these bands, such as the infrared bands which contain so much information about vegetation growth and condition, can't be seen with the human eye. So, how do we make pictures which show changes in reflected energy which the human eye can’t see? The answer is that the data are represented on a computer screen, or on a hardcopy print, using colours that we can see. The numbers recorded for the different satellite bands are displayed in red, green and blue colour guns on a computer screen.
When the red, green and blue bands of an image are assigned to the same colours on the computer screen, a true-colour image is formed. These images look like aerial photographs, since they indicate the true colours of objects - green trees and grass and brown soil. When mixtures of the visible and infrared bands are assigned to the red, green and blue colours on the computer, false-colour images are formed. In these images, the different colours on the screen represent different intensities in the wavelength bands that are assigned to each screen colour. Studies have shown that the human eye distinguishes changes in red better than in blue or green, so the band mostly strongly related to the feature of interest is usually assigned to the red colour on the screen.
As well as deciding which image band to assign to which screen colour, choices can be made about how to relate the range of numbers recorded by the satellite to the 256 levels of each colour on the computer screen. Although the satellite can record intensities between 0 and 255, typically the actual intensities associated with the ground covers present in agricultural images occupy a much smaller range of values. The way the range of digital numbers in the image is related to the computer colour levels is called image enhancement. Different image enhancements can be used to highlight different detail in an image. For example, the minimum image intensity could be set to colour level 0 and the maximum image intensity set to colour level 255. This would maximise the number of colours on the computer screen and show some information over the whole image. Alternatively, the range of image intensities corresponding to just remnant vegetation could be assigned to the 256 colour levels, highlighting the detail in the image about remnant vegetation at the expense of other cover types in the image.
The images below show different band and enhancement combinations. Different ground cover types and features are highlighted in each image. The images show the local variation in ground cover within a paddock and between the paddocks on a property.
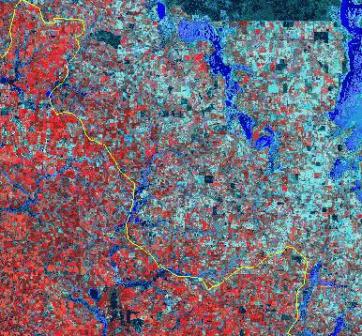
As well as showing differences in vegetation cover within a paddock or between different paddocks within a property, satellite images can also show broad regional trends in vegetation cover. The image below shows an area of about 125km by 115km north-east of Moora including the Kalannie-Goodlands catchment. The redder the image appears, the greater the green vegetation cover on the ground. The shift in colour from the south-west (bottom-left) to the north-east (top-right) is due to the decreasing rainfall (480mm to 340mm per annum) and the change from predominantly clay-based soils to largely sandy soils. The amount of green vegetation cover associated with a very good crop in the Kalannie-Goodlands catchment would only be considered to be average or poor in the catchments further to the south-west. The yellow line indicates the boundary between two stratification zones. These zones were treated separately during the salinity mapping process for this area.
How is This Information Being Used?
The information from remotely sensed images can be used in a number of ways for a number of purposes. It is usually combined with information from other data sources and with information from on-the-ground observations, called ground truth, to get a more complete picture of what is happening and to check suspected features or changes.
Scientists from CSIRO Mathematics, Informatics and Statistics and other agencies such as Agriculture Western Australia and Conservation and Land Management , have been using remotely sensed images to monitor changes in land condition.
Studies have focussed on mapping and monitoring changes in productivity caused by:
-monitoring wind erosion;
-monitoring waterlogging;
-monitoring the condition of remnant vegetation;
-cereal crop yield mapping;
-predicting salinity;
-monitoring rangeland condition.
Remote sensing provides a cost-effective method for mapping and monitoring broad areas, and has the advantage that the spread of diseases such as dieback is not enhanced by remote monitoring. Archived data can be used to monitor how areas have changed through time.
Monitoring information can then be combined with landform information to help predict which areas are at risk from salinity in the future, allowing remedial action to be taken where it is needed most (see the predicting salinity report).
Remote sensing is also increasingly being used for large-scale environmental monitoring programs like the State of the Environment Report and state-wide projects funded by the Natural Heritage Trust. It is able to offer large-scale monitoring relatively cheaply and easily, and can provide a baseline for future monitoring.