|
ABSTRACT
Getting guidance in an unknown land is no simple task. A system that would give the complete information on the travel plan, given the origin and destination in a simple form, clear to the user would be welcome. The Geographic Information System-based Travel Guidance System proposed in this study will provide the user/passenger with the map, showing clearly the route and all the bus stops that are met with during the journey, the distance to be traveled, the total duration of the journey and the travel cost. Various GIS tools have been used?to analyze the road network and perform spatial analysis on Chennai. It is possible to show the exact position of the buses by integrating the database with the Global Positioning System. Thus, the proposed Travel Guidance System will be the integration of partial information, location details and the key attributes of bus travel routine which provides the user?an effective guidance for a safe, economic travel and helps in effective decision making.
1. INTRODUCTION
It is a well known fact that Chennai is a fast growing city and has credit for its rich heritage and culture nurturing thousands of inflowing population with jobs and livelihood. Urbanization in this region has been tremendous and a number of industries and companies have popped up at every corner of the city. The growth of population and need for transportation is high due to several factors like location of workplace at far off places, centralization of facilities like shopping malls, recreation facilities, etc.. There arises necessity for transportation to cater to all the needs. Despite the availability of several means of transportation, bus happens to be the most popular mode. Frequency, economy and their omnipresence are some of the factors that contribute to the fact that many of the inhabitants of the city opt for the bus to suite their needs. There is also a necessity to reach their respective destination at the earliest, as everyone in this modern world is running to catch up with time. Also, it is not possible to know the exact position of the bus at the present day situation. The time at which it might reach the bus stop is highly variable as the time schedule cannot be relied upon due to the vehicle congestion. At this situation, if we could find an electronic display or touch screen at the bus stop which gives all the details namely, the distance of travel, duration of the travel, bus fare and a route map showing the exact position of the bus that we wish to travel in, would be a welcome. Providing all such details in the above mentioned form is the intention of this proposed system.
Public Information System using GIS-GPS integration by Rama Narayanan P. A., Prabu Sankar S., Raja Vijay Singh G is a paper which proposes similar system. It has also been implemented in Bangalore in which all this information is being provided in the Reliance phone. Another system named Infopolis also has an electronic display at the bus stops. Network System is the one implemented in Japan.
2. STUDY AREA
The city of Chennai, popularly known as Madras, one among the four major metropolitan cities, located in the southern India lies between 12° 09', 80° 12'NE and 13° 09', 80° 19'NE. It is having population of 6.04 million in an area of 170.47 Sq.km. The population growth is increasing at an average rate of 25% per decade. The city is situated in a hot climate zone and experiences tropical maritime monsoons. The minimum temperature ranges from 21° C to 24° C in the month of December to February and the average daily maximum temperature is 37° C during the month of May. The minimum monthly rainfall ranges from 6mm to 10mm in the month of February and maximum rainfall of 320mm has been recorded during the month of November. The average annual rainfall has been recorded as 192 cm. Chennai has two administrative boundaries, the outer boundary is Chennai metropolitan boundary which encompasses the suburban areas; the inner one is the corporation boundary, and includes only the urban area. It has Andra Pradesh as its boundary towards the North, Bay of Bengal at the East, Indian Ocean at the South and Kerala at its West.
2.1 Bus Service Information:
The Chennai Mofussil Bus Terminus or CMBT is a bus terminal in Chennai, India catering outstation buses. Spread over an area of 37?acre in Koyambedu, this is the largest bus terminus in Asia. The MTC provides various types of services identified by the colour of the route board:
TABLE:
| S.No. |
Board type |
Service |
Description |
Base fare (Rs.) + per 4km |
| 1 |
White Board |
Ordinary Service |
Stops at all bus stops |
2+.5 |
| 2 |
M |
M Service |
Same as ordinary with higher fare |
3+1 |
| 3 |
LSS |
Limited Stop Service |
Stops at alternate bus stops |
2.5+.5 |
| 4 |
Express |
Express Service |
Stops at few bus stops |
3+.5 |
| 5 |
PP |
Point to Point service |
Similar to express |
3+.5 |
| 6 |
Deluxe |
Deluxe Service (Yellow/Blue/White/Orange lines) |
Stops at all bus stops, deluxe buses |
5+1 |
| 7 |
Black Board |
Night Service |
LSS service after 10pm |
4+1 |
| 8 |
Ladies |
Ladies Special |
Ordinary services during peak hours for Ladies |
2+.5 |
| 9 |
Digital Board |
A/C Service |
Air conditioned Air Bus during peak hours |
10+4
|
There are about 51 bus depots, number of routes operated are 551 and the total number of buses operated are 2815. The total population served is over 70 lakhs and the passengers carried per day are over 3.85 million.
3. DATA USED:
NON SPATIAL DATA:
All the details that are required for the study such as the distance between bus stops in Chennai, the travel duration, the bus fare were collected from the conductors of the respective buses themselves in order to maintain accuracy. The important landmarks, road names and the bus stops were collected doing ground survey.
SPATIAL DATA:
| POLYGON: |
Chennai district map |
| LINE: |
Road network
The bus stops |
| POINT: |
Land marks
Position of the bus |
4. METHODOLOGY:
4.1 Map digitization:
The Chennai district map of scale 1:2000 was obtained from Survey of India. This was scanned to convert it to a digital format. A number of control points were chosen and their co-ordinates were obtained using the GPS. It was carefully geo referenced. It was then digitized on screen using the ArcGIS software. Attributes and labels were added.
The map that is used is accurate as it is being used to integrate with GPS which gives the co-ordinates of the bus that is being tracked. The position of this bus is shown on the same map. The route traveled by this bus is tracked and all the bus stops are indicated. All major land marks are shown in the map in order to make it useful to tourists and illiterates also.
FIG.1 CHENNAI MAP THAT HAS BEEN DIGITIZED SHOWING THE POPULATED POLYGON ATTRIBUTE TABLE.
NETWORK ANALYSIS:
This is an extension that has been provided in ArcGIS software and helps in creating shortest route and in tracking the route taken by the bus. The stops can be easily located with the options available in this module. They can be labeled to clearly show the stops.
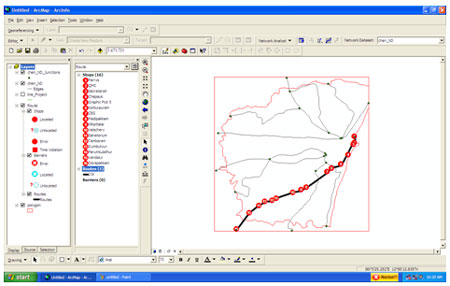
FIG.2 ROUTE CREATED USING NETWORK ANALYST SHOWING BUS STOPS
WORKING:
4.2 Obtaining co ordinates from the GPS
An in-vehicle module comprising of a GPS receiver and a GSM modem with microcontroller interfacing is placed inside each bus. A GPS receiver deduces the bus' location. The receiver has 4 data pins, from which the co-ordinates of the location of the bus with other information can be extracted.
THE NMEA FORMAT:
GPS receiver communication is defined within the NMEA specification. The data from the receiver includes the complete PVT (position, velocity, time) solution computed by the GPS receiver. All the GPS receivers can communicate and understand the NMEA data strings. Every NMEA string begins with a '$' symbol and ends with a Carriage Return (CR)/Line Feed (LF) sequence and can be no longer than 80 ASCII characters. The data is contained in a single line with data items like talker identity (GP for GPS) and position parameters separated by commas.
4.3 Micro-controller interface:
The data thus obtained from the GPS receiver is in the ASCII (American Standard Code for information Interchange) format acceptable by the microcontroller. Required assembly language programming is done in order to parse the data obtained from the GPS receiver and extract necessary information regarding the position (latitude and longitude) and time of recording the position of the GPS receiver (and hence the bus). To actually interface the microcontroller with the GPS receiver we use the MAX232 IC since the microcontroller uses Transistor-Transistor Logic(TTL). An external memory is connected to the microcontroller if necessary.
The microcontroller is programmed to compose the required position information into text messages and to automate the sending of these messages as SMSes via the modem in the in-vehicle module to the modem or mobile phone at the control station using AT commands.
For example the following commands can be used:
AT+CMGF=1
AT+CMGW="+919876543210"
> Message
AT+CMSS=1
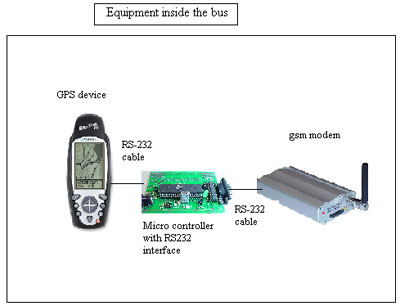
FIG.3 THE HARDWARE CONNECTION
4.4 Control Station:
At the control station, a modem or a cell phone receives these messages. This modem is connected to a computer which extracts the data and stores it in a file. It also deletes the message automatically. This is done with the help of software created using java programming and the usage of library JSMS engine which houses functionalities to send and receive messages to and from a cell phone. The software continuously polls for incoming messages to the cell phone connected to the server with the help of a compatible data cable.
The server at the control station has many modems or mobile phones connected to it to avoid bottleneck. And the messages received are put into queues depending on the bus from which the message is received. A program for time division multiplexing is written so that the processing is done in a cycle giving equal time for the co-ordinates from the database to be plotted on the map using Visual Basic to indicate visually the position of each bus.
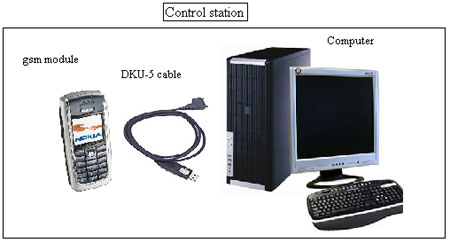
FIG.4 CONTROL STATION CONNECTION
Once the control station is ready with the information to be displayed, it has to send it to the LCD display module using real time communication.
In a similar fashion, a request for information from the user for a particular bus can be processed and the same displayed on the touch screen.
4.5 At the users end:
TOUCH SCREEN:
The touch screen accesses the control station server requesting the current details of the bus selected by the user. This is a very user friendly interface.
FIG.5 TOUCH SCREEN
ELECTRONIC DISPLAY:
The electronic display shows the updated, current position of the bus along with the details, in a cyclic manner, giving preference to the bus that reaches the bus stop earliest. In case there is more than a bus that reaches the bus stop at the same time, their respective details are displayed simultaneously.
FIG 4. ELECTRONIC DISPLAY
5. CONCLUSION
Implementation of the system in the major bus stops of Chennai would be of great help to the commuters of bus. Waiting time at the bus stop would be reduced to a great extent and the time of arrival can be much more reliable as the data obtained is real time. Congestion and unreliability of network since messages are sent through a third party network, sending the map from control station to clients at bus stops can be stated as the drawbacks of the system.
REFERENCES
* www.mapindia.org
* www.developershome.com
* http://www.smslib.org/
* www.edaboard.com
|


