Source: XIX IMEKO World Congress Fundamental and Applied Metrology September 6-11, 2009, Lisbon, Portugal
Abstract - The number of the non-linear equipments connected to the electrical energy distribution system is rising continuously. These equipments generate harmonic currents and voltages in the network impedances and they are added to the base signal deforming the value and the shape of the main voltage. The distorted voltage increases electrical strain and temperature load of the equipment (engines, transformers, capacitors, links, and cables) connected to the network. Moreover the operation of certain equipments connected to the electrical networks can be disturbed due to distorted voltage caused by noise generation.
These days the appearance of disturbance effects has greater and greater significance since entirely new regulations, standards and requirements of the EU have been emerged. On one hand the mentioned standards extend to the measurement methods of electrical networks and on the other hand to the limits of the most important electrical parameters as well. Consequently, it is apparent that more and more modern measurement methods and procedures are regulated which influence indirectly the human health and the continuity of industrial operations.
Keywords: electrical energy quality, specification of disturbance propagation direction, digital flicker measurement.
1. INTRODUCTION
Electrical power has to be treated like any other raw materials besides it is present in everyday life (e.g. in household activities) and in complex industrial processes. However reliable energy means different things for a customer and for an industrial activity. From the point of view of a simple customer this "reliable" energy has health significance in the first place; by contrast the industrial domains emphasize the undisturbed, continuous operation of production systems in terms of electric power.
This article presents the theoretical and practical description of two modern measurement methods in terms of informatics and electrical engineering.
In addition a digital flicker measurement system completed with several simulation programs and procedures will be demonstrated in this full paper.
2. THE STRUCTURE OF MEASUREMENT SYSTEM

Figure 1. The simplified schematic structure of the measurement system
At the Department of Electrical and Electronic Engineering a modern network diagnostic system was developed which is able to carry out a maximum thirty-day measurement, to evaluate measured data and to analyse them with the aim of later evaluation. Especially the energy consumption of industrial companies and institutions in North Hungarian regions are at the centre of our analysis. The work of electrical energy supplier can be eased with these measurements. This system has been developed continuously for about a decade, adapting to rapidly changing measurement requirements.
This system meets the parameters of the standard EN50160, furthermore it measures and analyses with the methods of the standard EN61000 (the standard CEI IEC 61000-4-15 EMC is used for measuring the flicker). These processes are considerably flexible, and every measuring computer can examine up to four three-phase systems with 20 kHz sampling rate per channel. Our measurement system is developed using Hall-effect transducers of the LEM Instruments and measuring hardware and software products of National Instruments.
Thus I would like to present the result of this one and half-year-old research about flicker measurement. The majority of the programs was written in language C in order to develop the complex system of signal processing.
2. THEORITICAL VIEW OF FLICKER
The disturbance effects of electrical networks are not only dangerous for the equipments but for human body as well due to vibration of lights, therefore it can result for example fatigability, exasperation, headache or sight failing as well. The flicker is the sequence of flashing lampimpulses thus it imperceptibly influences the human body and its environment. It is caused by fast fluctuation of voltage and the majority of these phenomena are produced by non-linear high-capacity equipments (switching effects of high-power loads, starting high power motors, using high welding performance etc.).
It is difficult to measure objectively the disturbing effect of flashing. The method of flicker measurement developed by UIE/IEC simulates the perception process of voltage fluctuation-lamp-eye-brain response. This procedure precisely indicates the reaction of the observed person in response to any flashing.
On the basis of observation completed with humans and animals, it turned out that humans are particularly sensitive to voltage fluctuation of near 8.8 Hz (Fig.2.). Consequently, the standards determine that mains voltage must not contain these previously mentioned frequency components.

Figure 2. CEI IEC 61000-3-3 flicker perception curve
3. DIGITAL FLICKER MEASUREMENT SYSTEM
The implementation of digital modules -suited for the latest expectations- had to be fulfilled during development. The accurate approximation of central digital filter cascade meant the most important step during planning which simulates lamp-eye-brain response.
Figure 3. Simplified block diagram of a flicker meter according to IEC 61000-4-15
The research began towards several directions simultaneously (Fourier-transformation-, Z-transformation-, and digital filter processes), taking the configurations of certain processes into consideration and putting the emphasis on accuracy and processing speed.
The real aim of the development was to create such software which is able to evaluate flicker values (including the offline and online signal processing). However it hasresulted further problems. To solve these problems several simulation programs were developed.
3.1. Digital flicker calibrating method
A modern digital calibrating process was developed so that the faults of flicker meter could be determined with precision. During the calibrating method we created a model according to the required standard so that complex filtering processes could be avoided by Fourier-, and inverse Fourier analysis. The supplied data by the written calibrating software meant the reference values. The process could be checked by specified reference signals, resulting the accurate values; however the software has worked quite slowly.
This program generates Pst responses specified to standard input signals. In case of a sine signal of 50 Hz completed with square modulation of 8.8 Hz, the program generates the result of Pst=1 (Fig.4.).

Figure 4. Digital calibrating process (LabWindows CVI)
3.2. Digital implementation of central weighting filters
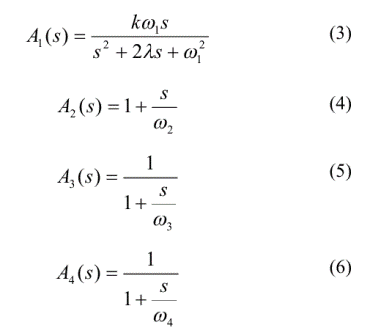
The Laplace - transfer function (1) defined in the standard CEI IEC 61000-4-15 EMC means the basis of digital processes.
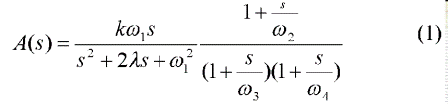
The approximation of the connection can be carried out in several ways. The cascade model determined in the standard primarily refers to analogous implementation therefore a program was developed to check the filter cascade as it had been specified in the standard.
It is possible to accomplish the filter cascade from two or three digital IIR filters. On the other hand, none of the solutions have resulted success since the lower frequency domain could be approximated inaccurately (this procedure involved the digital filter cascade consisting of Butterworth high-pass, low-pass and band-pass digital filters).
To create a more accurate flicker measurement system it is indispensable to have a better approximation (and digital filtering) of the frequency spectrum

Figure 5. Approximation of transfer function with digital filter cascade
Formula needed for Z-transformation (Tustin-formula):
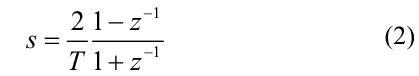
Two solutions were tried out during Z-transformation. Firstly, the complex transfer function of the central block was broken into four parts; secondly, they were transformed separately. After the proper mathematical rearrangement the filter coefficients were obtained thus the digital filter could be carried out.
The result of Z-transformation and the definition of filter coefficients:

Figure 6. Transversal model
After this mathematical transformation a program was developed (Fig.7.) to determine the accuracy of transfer functions. For this reason highly precise calculations were required (1012-1016) since digital filtering is the algebraic transformation of sampling data. The more errors one makes the less authentic the result will be.
Matlab Mathworks were also applied during the first transformations but at the same time for real application LabWindows CV1 was adopted. Furthermore, digital filters are used in this program (CVI) in addition their time need is also determined. The results were, of course, compared to the reference data, too. In the frequency spectrum the transfer function filters relative errors with maximum 2.3%. By contrast, the cascade specified by the standard filters the errors in much worse proportion (errors can occur from 5 to 30%).
Time was also a significant factor as an online or offline software evaluating flicker must be precise and rapid enough. Nowadays there are such equipments which are able to give the value of Pst almost immediately after the sampling time (1 min, 2 min, 5 min, 10 min). To calculate Plt offline method is necessary.
Both of these mentioned digital filter processes were built into a new program; besides their time need was also compared. On the basis of the results, the following conclusion could be drawn: the quadratic order digital filter could work two or three times faster than the digital cascade consisting of four filters. In spite of this fact both of the solutions gave the same accuracy result. Consequently, the former (the quadratic order digital filter) was used later on.

Figure 7. Software for digital filter

Figure 8. Flicker evaluating software
The offline data processing means only one segment of the problems. The online processing, similarly to offline, is even more complicated so several questions arise:
1. What kind of data should be stored: only Pst and Plt values? Or data before statistics processing (so that Pst and Plt values can be calculated later on)?
2. Does statistics module work fast enough to be able to calculate in an online way?3. What solutions are suitable for increasing the speed of statistical module?
These questions can be answered only later on therefore the research is going on.
4. PROPAGATION DIRECTION OF ELECTRICAL NETWORKS DISTURBANCES
The electrical energy quality considerably influences the reliability of industrial production, the economical use of energy, the frequency of breakdowns and directly the productivity and the competition. Supplied energy by power plants can be regarded 'reliable' in terms of disturbances. The pollution of network energy is caused by faulty, wrongly adjusted or operated customer and industrial equipments in 99 per cent. Such pollutions (e.g. harmonics, dip, transient, short noise, swells, overvoltage, notching, interruption. asymmetry) can cause extra expenses for other customers connected to network. Disturbances caused by a certain customer influence all the other customers of the network.
On a determined measurement point, the spreading direction and the type of disturbance sources can be simply and quickly defined with the help of the subsequent presented diagnostic software. Furthermore the place of disturbance source can be easily specified by measuring more points at the same time. Our research extends to disturbance propagation as well.
5. CONCLUSIONS
The aim of research-development work supported by the Regional University Knowledge Centre of Mechatronics and Logistics System is to work out a reliable system so that they could help to measure and evaluate electric power economy especially regarding small and medium-sized enterprises.
This system significantly differs from the conventional, electrical analyzing equipments since the measurements apply entirely new solutions in terms of electrical engineering and informatics (e.g. using fast and accurate online/offline network analysis), aiming the efficient utilization of electrical energy.
ACKNOWLEDGMENTS
Special thanks are due to the National Instruments Corporation, to all colleagues of the Department of Electrical and Electronic Engineering of the University, to the MLR-RET, to the KPI and to the NKTH.
REFERENCES
[1] R. Batorfi, Effect of Information Science Development on Research of Electrical Energetics, XVII. Szamokt - VIII. ENELKO Conference 2007, Romania, pp.12-15.
[2] CEI IEC 61000-4-15: 1997/A1:2003 Part 4: Testing and measurement techniques - Section 15: Flickermeter - Functional and design specifications, 2003.
[3] A. Dan, A villamosenergia - mindseg novelt rezkereszt-metszettel, Magyar Rezpiaci Kozpont, Budapest, 1999.
[4] A. Sz. Varadine, R. Batorfi, Development of Computing Method for Reactive Power Analysis, microCAD 2007, Miskolc, pp. 73-78.