ABSTRACT
The mathematical modeling of airflow through operating mine regulators is discussed. Results are used in the development of a computerized monitoring and simulation system to provide immediate or real time data on air behavior within each branch within an underground mine ventilation network through linking of sensors to the ventilation network simulation software. Software has been developed to link real time information generated by mine ventilation monitoring sensors into the network program to undertake network simulations and allow interpretation of key system data and operational changes. The outcome of the project is an online system which can report changes in the mine ventilation system, allow causes of changes to be isolated and rectified, improve balancing of available air throughout the mine and dispense with much of the labor used for underground ventilation measurement. The main work activities involved in the research program have involved examination and modeling of regulators, software modification and considerable mine site testing and optimizing activities.
INTRODUCTION
There is a move world wide to remote or telemetric monitoring of mine atmosphere conditions. Robust, suitable and as required, intrinsically safe instruments are available for measurement of, for instance, gas concentrations, air velocity and air pressure. These are often tied to extensive mine monitoring and communication systems.
One approach to establishing air quantity through a ventilation branch is through measurement of differential pressure across an opening or regulator. Mathematical relationships are available to relate (with some qualification) pressure drop and quantity through a regulator orifice placed symmetrically in a round flow conduit. However these can, at best, only be used to approximate mine regulator behavior due to:
the irregularity of mine regulators in shape and symmetry and their positioning in normally roughly square or rectangular mine airways;
the construction of the mine regulator opening which may result from, for instance, the operation of louvers, a sliding door, window or curtain or placement of drop boards;
uncontrolled air leakage through the regulator or adjacent bulkhead.
The stud describes efforts to characterize or mathematically model regulators. It then describes how this information is used in the development of a computerized monitoring and simulation system to provide immediate or real time information on each branch within an underground mine ventilation network through linking of sensors to the ventilation network simulation software. Software has been developed to link real time information generated by mine ventilation monitoring sensors into the network program to undertake network simulations and allow interpretation of key system data and operational changes.
The outcome of the project is an online system which can report changes in the mine ventilation system, allow causes of changes to be isolated and rectified and improve balancing of available air throughout the mine, It is envisaged that in time the real time model will be an integral part of a real time mine wide planning, monitoring and control software platform and will be updated in real time along with the mine plan.
The main steps involved in examination and modeling of regulators, software modification and considerable mine site testing and optimizing activities are described.
THEORY OF REGULATORS
A regulator is an artificial resistance (in the form of shock loss) introduced into an airway to control airflow.
Derivation of regulator equation
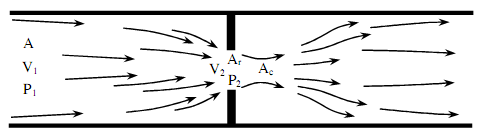
A regulator can be described as a large thin plate installed in a fluid conduit with an orifice. When a difference in pressure exists between the two sides fluid flows in the pattern shown in Figure 1. On the low pressure side the fluid issues as a converging jet in line with the centre of the orifice. The jet converges to its smallest area at a distance of about half the orifice diameter (Le Roux, 1979). This area is called the "vena contracta" (Ac at Fig. 1). The ratio between vena contracta and orifice area is the «coefficient of contraction», Cc (Ac / Ar at Fig. 1).
Figure 1. Airflow pattern through an orifice (after Burrows et al, 1989).
McElroy (1935) found that the Cc value is a relation between the ratio of the orifice and airway cross sectional area, N (Ar / A at Fig. 1), and Z, which is an empirical factor designated as the contraction factor, which is expressed as:
|
(1) |
Values of Z vary according to the edge shape of the orifice. Since most regulators are square edged, a Z value of 2.5 is most commonly used in calculating Cc . Bernoulli’s equation can be applied to both sides of the orifice as shown in Figure 1 in order to calculate the velocity and hence the airflow quantity.
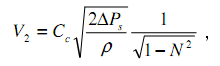
A correction must be made for the contraction of the jet at the vena contracta. Since the orifice is larger than the vena contracta, orifice velocity is lower than in the vena contracta. The velocity equated based on Bernoulli’s equations is the velocity at the vena contracta. Therefore, the velocity at the orifice can be obtained with the following equation:
|
(2) |
where Cc is the coefficient of contraction, as described before. Since airflow quantity through regulator Q = V2 Ar , it follows that:
|
(3) |
FIELD TESTS OF REGULATORS
Field tests were conducted at the University of Queensland Experimental Mine (UQEM) to verify air behavior in flow through regulators. Parameters measured were airflow quantity and pressure drop across the regulator. From pressure drop measurements, airflow quantity through the regulators can be calculated with Equation 3. Results of this calculation can be compared with measured values and the reasons for significant differences investigated.
UQEM tests
The UQEM regulator is the drop board type. Results of this test are summarized in Table 1. Based on ΔPs measured, predicted airflow quantity through the regulator, Q, was then calculated with Equation 3. Values of Q were compared with the measured quantity, Qm , as set down in Table 1 and Figure 2. It can be seen from both the table and figure that the measured quantity is consistently larger than predicted. There are several possible reasons as follows.
Table 1. Results of UQEM test.
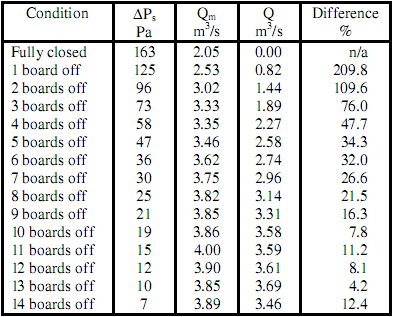
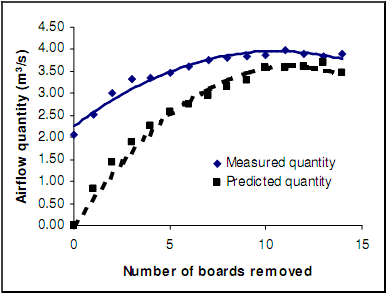
Figure 2. Comparison between measured and predicted quantity.
Error during measurement
It is common for operator induced errors to occur during mine drift measurement especially in small cross sectional airways. The authors experienced difficulty when measuring air velocity by continuous traversing because of limited space to move freely. Also, an author’s body provided a significant obstacle to the airflow.
Non-symmetrical condition and shape
Equation 3 was derived based on a circular orifice in the middle of a regulator plate. The UQEM regulator opening is located on the upper side and opening is rectangular leading to distorted air patterns.
Leakage
Leakage occurs due to the presence of gaps between boards and between the regulator frame and the air-way walls. The leakage quantity depends on regulator construction and the differential pressure drop across the opening. An approach is proposed to model the difference as air leakage since measurement error and the non-symmetrical condition were difficult to quantify. Therefore, the airflow quantity through the regulator can be expressed as:
|
(4) |
where Ql is the leakage quantity. Thus Ql needs to be quantified. An approach to this modeling is developed.
Relationship between airflow quantity and regulator resistance
The regulator can be treated as a set of two parallel airways namely:
The regulator opening.
The leakage paths, that is passages through and around the regulator other than the regulator orifice itself.
This can be illustrated as in Figure 3.
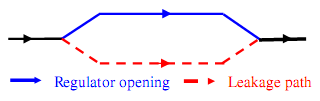
Figure 3. Airflow paths in regulator.
Therefore, the total resistance of regulator (Rt) can be modeled to consist of the regulator opening resistance (Ro) and the leakage path resistance (Rl). When the regulator is in a fully closed condition, the air flows through the leakage path only.
Airflow quantity through the regulator opening is calculated using the basic square law (ΔPs=R Q2).Based on this equation and Equation 3, the relationship between Ro and Ar can be established as follows.
|
(5) |
where A is the airway cross sectional area. Since this equation does not take leakage into account, the actual regulator resistance will be different to the one calculated by Equation 5. Thus actual resistance is Rt . Rt is made up of Ro and Rl in parallel configuration and so the relationship between them can be established. Since Ro has been quantified by Equation 5, Rl has to be quantified also to allow Rt to be calculated. Thus based on the measured pressure drop, the airflow quantity through the regulator can be determined.
Table 2. UQEM regulator resistances.
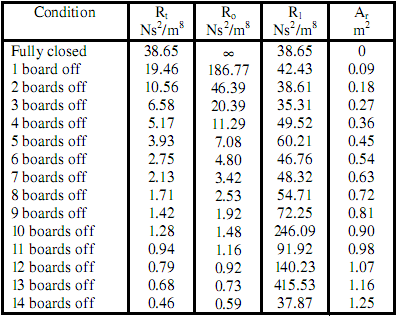
To do this, Ro is first calculated using Equation 5, and then the total resistance is calculated using the square law based on the measured pressure drop and the measured airflow quantity. Rl then can be calculated using the parallel airways resistance relationship. Table 2 shows the calculated resistance of theregulator tested at the UQEM.
To quantify Rl a plot against regulator opening area was made, as shown in Figure 4. It was found that Rl = 32.734e1.1631Ar. Therefore, the total regulator resistance, R could be calculated from:
|
(6) |
Therefore, the total regulator resistance, Rt could be calculated. The airflow quantity was then recalculated using the square law based on the new Rt . Results of this was then compared with measured values, Qm , as summarized in Table 3 and Figure 5.
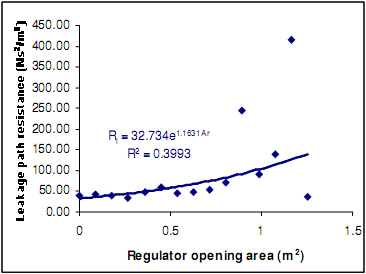
Figure 4. Quantification of resistance for leakage paths.
Table 3. Comparison between measured and new predicted quantity.
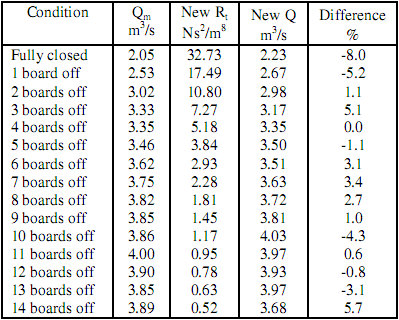
It can be seen from both the table and the graph that the difference is at all times less than 10 percent and within practical measurement tolerance.
Therefore this new equation is sufficiently reliable to be employed for further analysis. Based on this, regulator characteristic curves can be drawn for different mine configurations as shown in Figure 6. From these the relationship between the new total resistance and regulator opening area can be derived is shown in Figure 7.
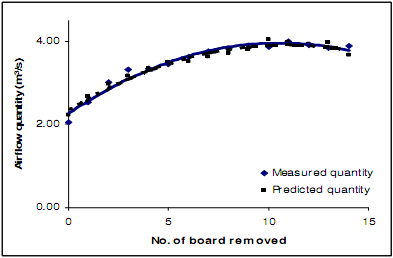
Figure 5. Comparison between measured and new predicted quantity.
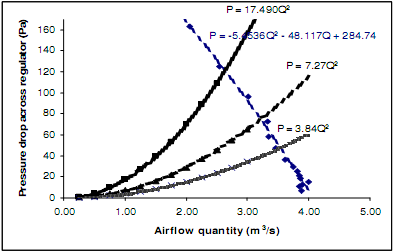
Figure 6. UQEM regulator characteristic curves.
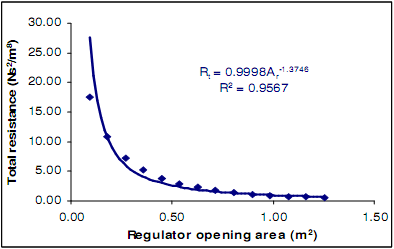
Figure 7. Relationship between new total resistance and regulator opening area.
An investigation was conducted to check on whether the test method maintained accuracy with less measurement data. It was found that with half the number of measurements taken (removing two boards at one time instead of one board) differences remained mostly less than 10 percent and the method was still considered reliable.
UQEM REAL TIME MINE VENTILATION SYSTEM
The aim of this mine ventilation research was to develop a computerised monitoring system to provide immediate or real time simulated information on each branch within an underground ventilation network. The system measures airflow or air pressure changes in selected ventilation branches and simulate flows through all other branches. This new approach to ventilation provides improved understanding of airflows through all mine sections. The popular ventilation simulation modeling program Ventsim has been used as a simulation engine within the system. This software has been altered to accept real time information generated by underground mine ventilation monitoring sensors, undertake network simulations and interpret key system data and operational changes. Once the simulation program has updated readings it can remodel the whole mine system, report the flows in all branches and compare individual branch readings with expected values.
The UQEM was used to test the integration of a telemetry system into the Ventsim network analysis environment. An isometric plan of the UQEM is shown in Figure 8. The mine airflow monitoring system included consisted of one El-Equip «Flosonic» and two vortex shedding Sieger BA5 air velocity sensors. The FloSonic air velocity sensor is an ultra-sonic anemometer measuring the average air velocity value across a drift with very good accuracy (Casten et al, 1995 & McDaniel et al, 1999). The initial aim of this testing was to use the system to monitor changing ventilation conditions, to establish airflow characteristics within the UQEM and to observe the resimulated network results.
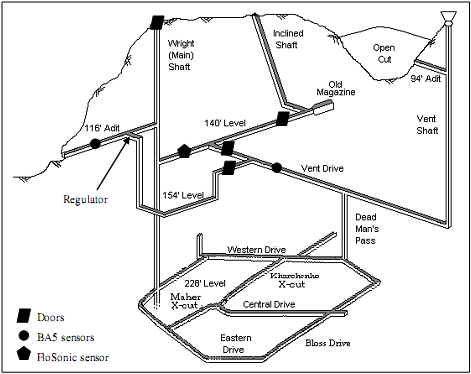
Figure 8. Plan of UQEM showing location of doors and sensors.
Achievement of the main research aim was facilitated with the development of a real time solution requiring data communication links between the various system components. These components included the UQEM telemetry monitoring system, the telemetry control software, the developed data manipulation applications, a File Transfer Protocol (FTP) application and a modified real time version of Ventsim. Details of the integration of the UQEM real time ventilation monitoring system including Ventsim modification have been described by Gillies et al (2000).
CONCLUSION
Efforts to characterize or mathematically model a number of operating mine regulators have been described. Underground measurements have indicated that theoretical calculations to predict airflow quantity through practical mine regulators based on measured pressure drop are inadequate. The theoretical approaches are limited as they are based on prediction of fluid flow through a circular orifice in the middle of a plate whereas most mine regulators have a rectangular non-symmetrically positioned orifice. Also, most importantly, there is air leakage through the regulator bulkhead frame and gaps that increase actual quantity compared to that predicted.
The way to overcome this difference is to quantify the resistance of the leakage path based on regulator opening area and then recalculates the total resistance of the regulators. The relationship between leakage path resistance and regulator opening area varies, but the resistance should increase along with an increase in opening area. Based on measured pressure difference, the airflow quantity can be predicted accurately using the basic square law. It requires field measurement to quantify the leakage path resistance of each regulator, since each regulator has its own leakage characteristic (size and number of gaps, etc.). This is a tedious work, since the regulators can be set with many opening areas. However, it was found that with limited measurement data, prediction results are still accurate within acceptable tolerance appropriate to understanding mine airflows.
The aim of the study was to gain greater understanding of a computerized monitoring system to provide immediate or real time simulated information in each branch of an underground ventilation network. The system measures airflow in selected ventilation branches and simulates flows through all other branches. An investigation was undertaken as to whether the UQEM Real Time Airflow Monitoring system can detect changes within the mine ventilation system, examine accuracy of the system and identify constraints that will limit performance of the system. As a result of trials, it was demonstrated that the system was able to detect changes occurring within the mine ventilation system and was also able to predict the changes accurately. Limitations caused by transient period delays have been examined. Updating of simulation models from use of real time data has also been discussed. It is envisaged in the future that the ventilation model would be an integral part of a real time mine wide planning, monitoring and control software platform from which the model would be updated in real time.
Burrows, J., Hemp, R., Holding, W., Stroh, R.M., 1989. Environmental Engineering in South African Mines, 2nd edition, pp 66-70 Mine Vent. Soc. South Africa, Johannesburg.
Casten, T., Mousset-Jones, P., Calizaya, F., 1995. Ultra-sonic Anemometry in Underground Excavations, Proc 7th US Mine Vent Sym, Lexington, Kentucky, 1995, pp 429-434. Ed A.M. Wala. SME, Littleton, Colorado, USA.
Gillies, A.D.S., Mayes, T.I., Wu, H.W., Kizil, M., Wang, N., 2000. The Development of a Real Time Airflow Monitoring and Control System, Proc 1st Mine Envirn and Vent Sym, Dhanbad, India, 2000, pp 255-264. Ed D. C. Panigrahi. A.A. Balkema, Rotterdam.
Kingery, D.S., 1960. Introduction to Mine Ventilating Principles and Practices, US Bureau of Mines Bul 589, pp 89 (US Bureau of Mines, Washington DC).
Le Roux, W.L., 1979. Mine Ventilation Notes for Beginners, 3rd edition, pp 131-133 Mine Vent. Soc. South Africa, Johannesburg.
McDaniel, K., Duckworth, I.J., Prosser, B.S., 1999. Evaluation of Different Airflow Sensors at the WIPP Facility, Proceedings of 8th US Mine Vent Sym, Rolla, Missouri, 1999, pp 519-525. Ed J.C. Tien. SME, Littleton, Colorado, USA.
McElroy, G.E., 1935. Engineering Factors in Ventilating Metal Mines, US Bureau of Mines Bull 385, pp 55-68 (US Bureau of Mines, Washington DC).