Cushion Treemaps: Visualization of Hierarchical Information
Jarke J. van Wijk
Eindhoven University of Technology
Dept. of Mathematics and Computing Science
P.O. Box 513, 5600 MB Eindhoven, The Netherlands
f vanwijk, wstahw g @win.tue.nl
October 25-26, 1999
Source of information: http://www.win.tue.nl/~vanwijk/ctm.pdf
Abstract
A new method is presented for the visualization of hier- archical information, such as directory structures and orga- nization structures. Cushion treemaps inherit the elegance of standard treemaps: compact, space-filling displays of hi- erarchical information, based on recursive subdivision of a rectangular image space. Intuitive shading is used to pro- vide insight in the hierarchical structure. During the subdi- vision ridges are added per rectangle, which are rendered with a simple shading model. The result is a surface that consists of recursive cushions. The method is efficient, ef- fective, easy to use and implement, and has a wide applica- bility.
1 Introduction
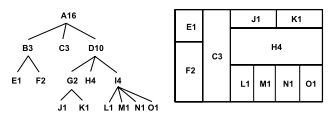
Hierarchical structures of information are ubiquitous: family trees, directory structures, organization structures, catalogues, computer programs, etcetera. Small hierarchi- cal structures are very effective to locate information, but the content and organization of large structures is much harder to grasp. We present a new visualization method for such large hi- erarchical structures: Cushion Treemaps. The method is based on treemaps, developed by Shneiderman and Johnson [11, 8]. Treemaps are efficient and compact displays, which are particularly effective to show the size of the final ele- ments in the structure. Cushion Treemaps provide shading as a strong extra cue to emphasize the hierarchical structure. For a quick impression, figure 2 and 3 show treemaps, figure 5 and 6 show the corresponding cushion treemaps. In section 2 we discuss existing methods to visualize hi- erarchical structures. The new method is presented in sec- tion 3. The embedding of the method in an interactive sys- tem for tree visualization is described in section 4. Finally, we discuss extensions and alternatives in section 5, and we summarize the results in section 6.
2 Background
Many methods exist to display and browse through hi- erarchical information structures, or, for short, trees. File browsers are the best known example. Usually a listing of the files and directories is used, where the levels in the hi- erarchy are shown by means of indentation. The number of files and directories that can be shown simultaneously is lim- ited, which is no problem if one knows what to search for. However, if we want to get an overview, or want to answer a more global question, such as: ”Why is my disk full?”, scrolling, and opening and closing of subdirectories have to be used intensively. During this process it is hard to form a mental image of the overall structure [3].


3 Cushion treemaps
3.1 Method
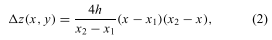
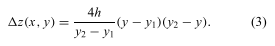
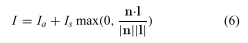
How can we use shading to show the tree structure? The human visual system is trained to interpret variations in shade as illuminated surfaces [6]. Hence, we can answer the question by constructing a surface which shape encodes the tree structure. We introduce our solution with a simple one-dimensional example: binary subdivision of an interval. First, we sub- divide the interval and add a bump to each of the two subintervals. Next, we repeat this step recursively. To each new sub-interval we add a bump again, with the same shape but half of the size of the previous one. If we do this for three levels, the results are eight segments and the top-most curve in figure 4. If we interpret this curve as a side view of a bent strip, and render it as viewed from above, the bumps trans- form into a sequence of ridges. The separate segments are clearly visible, each is bounded by the sharp discontinuities in the shading. Furthermore, also the binary tree structure is clearly visible, because the depth of the valleys between the segments is proportional to the distance between segments in the tree.


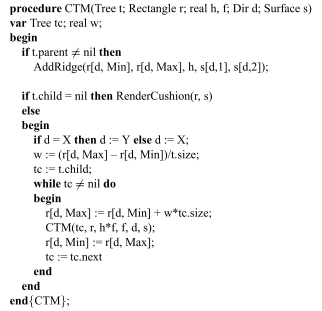
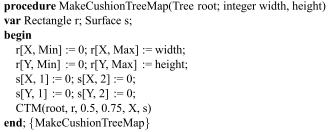
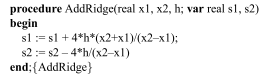
3.2 Algorithm
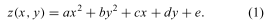
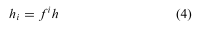
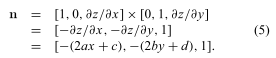
With the ingredients supplied in the previous section, the complete algorithm can be derived. We present it here in full detail, not because of its complexity, but to show its sim- plicity. First, we define a few data types. The directions X and Y are encoded via array-indexing to enable a com- pact algorithm. The surface is described by its linear and quadratic coefficients for the X- and Y-direction. For a Sur- face s the coefficients a, b, c, and d of equation (1) corre- spond to s[X,2], s[Y,2], s[X,1], and s[Y,1] respectively. The constant coefficient e can be ignored here, because it is not used in the shading calculation. Each tree record has an associated size, and a pointer to its parent, to its first child, and to the next sibling.


4 Interaction
Presentation of hierarchical structures is only one aspect, for effective visualization of such structures interaction is equally important. We have embedded cushion treemaps in SEQUOIAVIEW, our interactive system for the analysis and visualization of large tree structures. The cushion treemaps are generated with a slightly extended version of the pre- vious algorithm. This takes less than a second on an SGI O2, even for larger images and trees. Upon each interaction the image is copied to the screen, annotation is overlaid, se- lected rectangles are colored by superimposing transparent rectangles. Various coloring options are available, to show the size, the level, and other attributes of the leaves. Regen- eration of the image is done only if the tree or one of the im- age parameters change. Many options are provided for navigation and selection. The user can click on rectangles, upon which the properties of the leaf are displayed in a separate window. The current node is highlighted with a red outline. The arrow keys can be used to select siblings (left, right), the parent (up) and the first child (down). The selected elements are continu- ously updated and highlighted, which enables fast and accu- rate navigation. Elements within a user-defined size range can be selected, and elements can be selected by matching their name with regular expressions. The user can zoom in on sub-trees, and zoom out again. SEQUOIAVIEW has been used for various applications: file systems, tries, organization charts, lexical parse trees, and software structures. The cushion treemaps, supported by multiple options for navigation and selection, turned out to be highly effective.
5 Discussion
Both simpler and more complex variants of the cushion treemap presented here are conceivable. We consider both here to show that the version presented is optimal, in the sense that these variants are no improvements. We have chosen to use a geometric model, which is shown as a shaded surface viewed from above. We could also have used a direct, 2D model for the shading. This could lead to a more efficient algorithm, without the normal- ization of the normal per pixel. For instance, the value of z.x;y/as defined before could directly denote an intensity. However, such a simple model does not work satisfactorily. The result is that each rectangle is filled with an ellipse- shaped spot. More sophisticated 2D models could work, but their control is cumbersome, when compared to the intuitive model with two parameters (h, f ) presented here. The use of a geometrically based shading leads automatically to an image that is easy to interpret. Another option is to view the surface from an oblique an- gle as a 3D surface. However, 3D views do not pay off. The 3D view is more expensive to generate, the height itself does not provide a direct cue on the structure, and the only view where all rectangles can be viewed simultaneously is the top view. Rather, we will spend effort in other areas. Some open questions are: – How can anti-aliasing be provided, to handle rectangles that fall between pixels? – How can we effectively present multi-dimensional at- tributes per leaf? – How can graph-information (e.g. symbolic links in file systems) be included? – Does the combination of this representation with other types of presentations pay off? – Can the presentation of size be improved, such that per- ceptual characteristics are taken into account? Summarizing, still much work has to be done in the area of tree visualization.
6 Conclusions
We have presented a new method to visualize hierarchical information. Cushion treemaps inherit the elegance of stan- dard treemaps, and add intuitive shading to provide insight in the hierarchical structure. Their features can be summa- rized as follows: – efficient: generation of an image typically takes less than a second; – effective: the structure is visualized much more effective compared with standard treemaps. This is obvious if we compare for instance figure 3 with figure 6; – compact: the display area is used very efficiently, more than 3000 leaves can be displayed easily in an image with 640 to 480 resolution. As a result, no scrolling or open- ing/closing of nodes is needed to view the whole struc- ture; – easy to implement: the complete algorithm fits on one page; – easy to control: the appearance can be controlled with a few intuitive parameters, for which default values often suffice. Finally, cushion treemaps address one of the most important topics in visualization. Their wide applicability is probably what has struck us most during our research.
References
[1] A. Bruggemann-Klein and D. Wood. Drawing trees nicely with tex. Electronic Publishing, 2(2):101–115, 1989. [2] S.K. Card, G.G. Robertson, and J.D. Mackinlay. The information visualizer, an information workspace. In Proc. of ACM CHI’91, Conference on Human Factors in Computing Systems, pages 181–188, 1991. [3] R. Chimera, K. Wolman, and B. Shneiderman. Eval- uation of three interfaces for browsing hierarchical ta- bles of contents. Technical Report Technical Report CAR-TR-539, CS-TR-2620, University of Maryland, February 1991. [4] S.G. Eick. Visualization and interaction techniques. In CHI97 Tutorial notes on Information Visualization. ACM SIGCHI, March 1997. [5] J.D. Foley, A. van Dam, S.K. Feiner, and J.F. Hughes. Computer Graphics – Principles and practice, 2nd edition. Addison-Wesley, Reading, MA, 1996. [6] W. T. Freeman, E. H. Adelson, and A. P. Pent- land. Shape-from-shading Analysis with Shadelets and Bumplets. In Inv. Opth. and Vis. Sci. (supp), 31, page 410. Association for Research in Vision and Oph- thalmology, Spring 1990. [7] G.W. Furnas. Generalized fisheye views. In Proc. of ACM CHI’86, Conference on Human Factors in com- puting systems, pages 16–23, 1986. [8] B. Johnson and B. Shneiderman. Treemaps: a space- filling approach to the visualization of hierarchical in- formation structures. In Proc. of the 2nd International IEEE Visualization Conference, pages 284–291, Octo- ber 1991. [9] D.E. Knuth. Fundamental algorithms, art of computer programming, volume 1. Addison-Wesley, Reading, MA, 1973. [10] G.G. Robertson, J.D. Mackinlay, and S.K. Card. Cone trees: animated 3d visualizations of hierarchical infor- mation. In Proc. of ACM CHI’91, Conference on Hu- man Factors in Computing Systems, pages 189–194, 1991. [11] B. Shneiderman. Tree visualization with tree-maps: a 2d space-filling approach. ACM Transactions on Graphics, 11(1):92–99, September 1990.