Ordered Treemap Layouts
Ben Shneiderman and Martin Wattenberg
University of Maryland and Columbia University
Source of information: ftp://ftp.cs.umd.edu/pub/hcil/Reports-Abstracts-Bibliography/2001-06html/2001-06.htm
Abstract
Treemaps, a space-filling method of visualizing large hierarchical data sets, are receiving increasing attention. Several algorithms have been proposed to create more useful displays by controlling the aspect ratios of the rectangles that make up a treemap. While these algorithms do improve visibility of small items in a single layout, they introduce instability over time in the display of dynamically changing data, and fail to preserve an ordering of the underlying data. This paper introduces the ordered treemap, which addresses these two shortcomings. The ordered treemap algorithm ensures that items near each other in the given order will be near each other in the treemap layout. Using experimental evidence from Monte Carlo trials, we show that compared to other layout algorithms ordered treemaps are more stable while maintaining relatively low aspect ratios of the constituent rectangles. A second test set uses stock market data.
1. Introduction
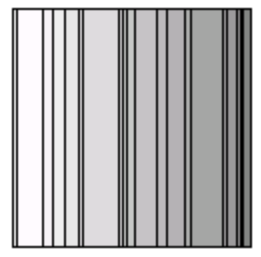
Treemaps are a space-filling visualization method capable of representing large hierarchical collections of quantitative data [S92]. A treemap (Figure 1) works by dividing the display area into a nested sequence of rectangles whose areas correspond to an attribute of the data set, effectively combining aspects of a Venn diagram and a pie chart. Originally designed to visualize files on a hard drive, treemaps have been applied to a wide variety of domains ranging from financial analysis [JT92, W98] to sports reporting [JB97]. A key ingredient of a treemap is the algorithm used to create the nested rectangles that make up the map. (We refer to this set of rectangles as the layout of the treemap.) The slice and dice algorithm of the original treemap paper [S92] uses parallel lines to divide a rectangle representing an item into smaller rectangles representing its children. At each level of hierarchy the orientation of the lines - vertical or horizontal - is switched. Though simple to implement, the slice-and-dice layout often creates layouts that contain many rectangles with a high aspect ratio. Such long skinny rectangles can be hard to see, select, compare in size, and label. [TJ92, BHW00]
2. Algorithms for ordered treemaps
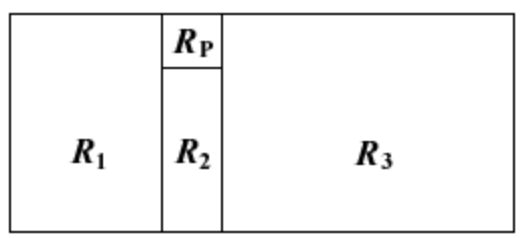
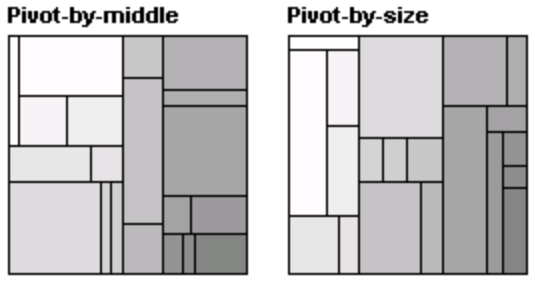
The key insight that leads to algorithms for ordered treemaps is that it is possible to create a layout in which items that are next to each other in the given order are adjacent in the treemap. Although such a layout does not follow the simple linear order of the slice-and-dice layout, it provides useful cues for locating objects and turns out to provide constraints on the layout that discourage large discontinuous changes with dynamic data. We discuss two closely related algorithms for creating layouts that approximately preserve order. Both follow a similar recursive process, starting with a rectangle R to be subdivided. The input is a list of items that are ordered by an index and have varied areas. A particular item (the pivot) is chosen and placed at the side R as a square (aspect ratio = 1). The remaining items in the list are placed in three large rectangles that make up the rest of the display area. The algorithm is then applied recursively to each of these rectangles. In the first algorithm, pivot-by-size, the pivot is taken to be the item with the largest area. The motivation for this choice is that the largest item will be the most difficult to place, so it should be done first. The algorithm, as illustrated in
3. Metrics for treemap layouts: aspect ratio & change
In order to compare treemap algorithms we define two measures: the average aspect ratio of a treemap layout, and the layout distance change function, which quantify the visual problems created by poor layouts. The goal is to have a low average aspect ratio and a low distance change as data is updated. We define the average aspect ratio of a treemap layout as the unweighted arithmetic average of the aspect ratios of all leaf-node rectangles. This is a natural measure, although certainly not the only possibility. One alternative would be a weighted average that places greater emphasis on larger items, since they contribute more to the overall visual impression. We choose an unweighted average since the chief problems with high aspect ratio rectangles—poor visibility and awkward labeling—are at least as acute for small rectangles as large ones. The layout distance change function is a metric on the space of treemap layouts that allows us to measure how much two layouts differ, and thus how quickly or slowly the layout produced by a given algorithm changes in response to changes in the data. To define the distance change function, we begin by defining a simple metric on the space of rectangles. Let a rectangle R be defined by a 4-tuple (x,y,w,h) where x and y are the coordinates of the upper left corner and w and h are its width and height. We use the Euclidean metric on this space, i.e. if rectangles R1 and R2 are given by (x1, y1, w1, h1) and (x2, y2, w2, h2) respectively, then the distance between R1 and R2 is given by

4. Experimental design and results
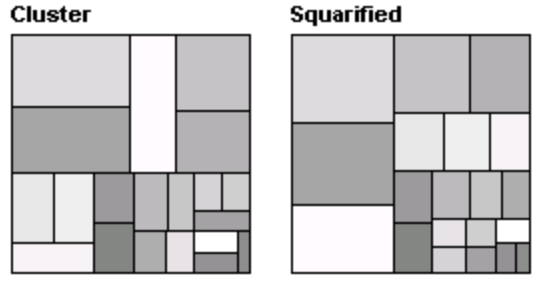
To compare the performance of ordered treemap layout algorithms to squarified, cluster and slice-and-dice layouts, we ran two sets of experiments. The first consisted of a sequence of Monte Carlo trials to simulate continuously updating data. Our goal was to measure the average aspect ratio and average layout distance change produced by each of five algorithms. In the second experiment we measured the average aspect ratio produced by each of the algorithms for a static set of stock market data.
4a. Monte Carlo trials
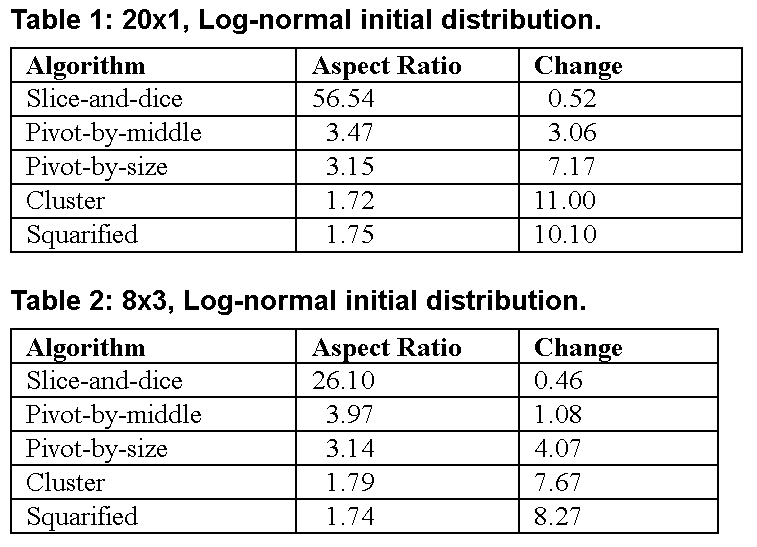
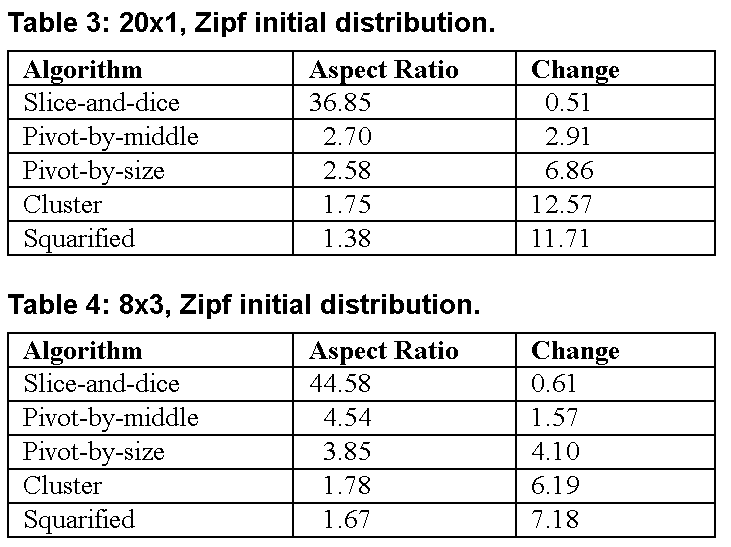
To simulate the performance of the five layout algorithms under a variety of conditions, we performed experiments on two types of hierarchies with two different statistical distributions of item sizes. The first hierarchy (“20x1”) was a collection of 20 items with one level of hierarchy. The second (“8x3”) was a collection with three levels of hierarchy and eight items at each level for a total of 512 items. For each experiment we ran 100 trials of 100 steps each. In one experiment we began with data drawn from a log-normal distribution created by exponentiating a normal distribution with mean 0 and variance 1. In a second version, we used data drawn from a Zipf distribution with power parameter equal to 1. Both distributions are representative of naturally occurring positive-valued data [R97]. In each step of a trial the data was modified by multiplying each data item by a random variable ex, where x was drawn from a normal distribution with variance 0.05 and mean 0. All layouts were created for a square with side 100. The results are shown in tables 1 through 4.
4b. Static stock market data
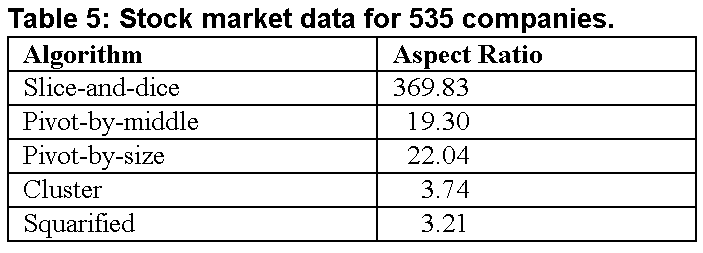
Our second set of experiments consisted of applying each of the five algorithms to a set of 535 publicly traded companies used in the SmartMoney Map of the Market [W98] with market capitalization as the size attribute. For each algorithm we measured the aspect ratio of the layout it produced. The results are shown in the first column of Table 5, and the layout produced are shown in Figures 5-9 at the end of this paper. Note that although aspect ratios are higher than in the statistical trials-partly due to outliers in the data set-the broad pattern of results is similar.
5. Conclusion and future directions
Treemaps are a popular visualization method for large hierarchical data sets. Although researchers have recently created several algorithms that produce create clear, legible treemap layouts with low aspect ratios, these new algorithms have two drawbacks: they are unstable under updates to the data, and they scramble any natural order on the items being mapped. We introduced ordered treemaps, which alleviate these problems by creating layouts that preserve order and that update cleanly for dynamically changing data. Experimental results show that they offer a useful compromise between the smooth updates of the slice-and-dice method and the low aspect ratios of cluster treemaps and squarified treemaps. There are several directions for future research. First, there is doubtless room to optimize the ordered treemap algorithms discussed in this paper, especially to improve the overall aspect ratios they produce. It would also be useful to optimize the algorithms used by cluster treemaps and squarified treemaps to improve stability under dynamic updates. Another practical area to explore would be matching layout algorithms to particular statistical distributions of data and changes in the data, since different algorithms may be appropriate in different situations. More speculatively, since experimental results suggest a tradeoff between aspect ratios and smoothness of layout changes, it would be worthwhile to look for a mathematical theorem that makes this tradeoff precise. It might also be fruitful to explore variants of treemap layouts that can update smoothly by using past layouts as a guide to current ones, or by using tiles that can have nonrectangular shapes.


Acknowledgement:
Thanks to Ben Bederson for thoughtful suggestions on the draft.
6. References
[BHW00] Bruls, D.M., C. Huizing, J.J. van Wijk. “Squarified Treemaps”. In: W. de Leeuw, R. van Liere (eds.), Data Visualization 2000, Proceedings of the joint Eurographics and IEEE TCVG Symposium on Visualization, 2000, pp. 33-42. [JB97] Jin, L. and Banks, D.C. “TennisViewer: A Browser for Competition Trees.” IEEE Computer Graphics and Applications, July/August, pp. 63-65, 1997. [JS91] Johnson, B. and and Shneiderman, B. “Tree-maps: A Space-filling Approach to the Visualization of Hierarchical Information Structures.” Proceedings of the IEEE Visualization ’91, pp. 284-291, October 1991. [J94] Johnson, B. “Treemaps: Visualizing Hierarchical and Categorical Data” Unpublished PhD dissertation, Dept. of Computer Science, University of Maryland, College Park, MD (UMI-94-25057), 1994. [JT92] Jungmeister, W-A. and Turo, D. “Adapting Treemaps to Stock Portfolio Visualization,” University of Maryland Technical Report CS-TR-2996, 1992. Available at http://www.cs.umd.edu/hcil/pubs/tech-reports.shtml [R97] Sheldon, R. A First Course in Probability, Prentice Hall 1997. [S92] Shneiderman, B. “Tree Visualization with Tree-Maps: 2-d Space-filling Approach.” ACM Transactions on Graphics, 11(1), pp. 92-99, 1992. [TJ92] Turo, D. and Johnson. B. “Improving the Visualization of Hierarchies with Treemaps: Design Issues and Experimentation.” Proceedings of the IEEE Visualization 92, pp. 124-131, October 1992. [VN00] Vernier, F. and Nigay, L. “Modifiable Treemaps Containing Variable-Shaped Units”, Extended Abstracts of the IEEE Information Visualization 2000. Available at http://iihm.imag.fr/publs/2000/Visu2K_Vernier.pdf [W98] Wattenberg, M. “Map of the Market. “SmartMoney.com, http://smartmoney.com/marketmap, 1998. [W99] Wattenberg, M. “Visualizing the Stock Market,” Proceedings of ACM CHI 99, Extended Abstracts, pp.188-189, 1999.