Squarified Treemaps
Mark Bruls, Kees Huizing, and Jarke J. van Wijk
Eindhoven University of Technology
Source of information: http://www.win.tue.nl/~vanwijk/stm.pdf
Abstract.
An extension to the treemap method for the visualization of hierarchi- cal information, such as directory structures and organization structures, is pre- sented. The standard treemap method often gives thin, elongated rectangles. As a result, rectangles are difficult to compare and to select. A new method is presented to generate lay-outs in which the rectangles approximate squares. To strenghten the visualization of the structure, shaded frames are used around groups of related nodes.
1 Introduction
Hierarchical structures of information are everywhere: directory structures, organization structures, family trees, catalogues, computer programs, and so on. Small hierarchical structures are effective to locate information, but the content and organization of large structures is harder to grasp. We present a new visualization method for large hierarchi- cal structures: Squarified Treemaps. The method is based on Treemaps, developed by Shneiderman and Johnson [9, 6]. Treemaps are efficient and compact displays, which are particularly effective to show the size of the final elements in the structure. In a previous paper [10] we introduced Cushion Treemaps, which provide shading as an extra cue to emphasize the hierarchical structure. In this paper we attack another problem of stan- dard treemaps: the emergence of thin, elongated rectangles. We propose a new method to subdivide rectangular areas, such that the resulting subrectangles have a lower aspect ratio. These rectangles use space more efficiently, are easier to point at in interactive en- vironments, and are easier to estimate with respect to size. Because the resulting struc- tures are somewhat harder to grasp, we also introduce an improved method to visualize nested structures. A variant on nested treemaps is presented, where the rectangular en- closures have been replaced by shaded frames. The combination of these two methods leads to displays of hierarchical structures that are efficient and easy to understand. In section 2 we discuss existing methods to visualize hierarchical structures. The new method for improved subdivision is presented in section 3. The shaded frames are de- scribed in section 4. Finally, we discuss the results in section 5.
2 Background
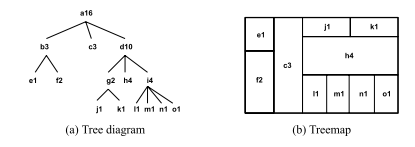
Many methods exist to browse through and to display hierarchical information struc- tures, or, for short, trees. File browsers are the best known example. Usually a listing ofthe files and directories is used, where the levels in the hierarchy are shown by means of indentation. The number of files and directories that can be shown simultaneously is limited, which is no problem if one knows what to search for. However, if we want to get an overview, or want to answer a more global question, such as: ”Why is my disk full?”, scrolling, and opening and closing of subdirectories have to be used intensively. During this process it is hard to form a mental image of the overall structure [3]. Many techniques have been proposed to visualize such structures more effectively. An important category are node and link diagrams (fig. 1(a)). Elements are shown as nodes, relations are shown as links from parent to child nodes. Sophisticated techniques have been presented to improve the efficiency and aesthetic qualities of such diagrams, both in 2D and in 3D [7, 5, 1, 2, 8]. Such diagrams are very effective for small trees, but usually fall short when more than a couple of hundred elements have to be visualized si- multaneously. The main reason for this limitation is simply that node and link diagrams use the display space inefficiently: Most of the pixels are used as background. Treemaps

3 Squarification
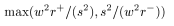
How can we tesselate a rectangle recursively into rectangles, such that their aspect-ratios (e.g. max( height = width ; width = height )) approach 1 as close as possible? The number ofall possible tesselations is very large. This problem falls in the category of NP-hard prob- lems. However, for our application we do not need the optimal solution, a good solution that can be computed in short time is required. We have experimented with many different algorithms. In this section we present a method that (empirically) turned out to give the best results. The key idea is based on two notions. First, we do not consider the subdivision for all levels simultaneously. This leads to an explosion in computation time. Instead, we strive to produce square-like rect- angles for a set of siblings, given the rectangle where they have to fit in, and apply the same method recursively. The startpoint for a next level will then be a square-like rect- angle, which gives good opportunities for a good subdivision. Second, we replace the straigthforward subdivision process for a set of siblings of the standard treemap tech- nique (width or height is given, rectangle is subdivided in one direction) by a process that is similar to the hierarchical subdivision process of the standard treemap. We present our method first with an example, followed by a description of the com- plete algorithm.
3.1 Example
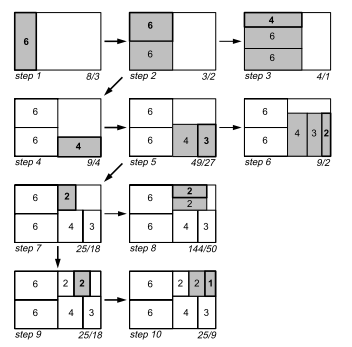
Suppose we have a rectangle with width 6 and height 4, and furthermore suppose that this rectangle must be subdivided in seven rectangles with areas 6, 6, 4, 3, 2, 2, and 1 (figure 3). The standard treemap algorithm uses a simple approach: The rectangle is subdivided either horizontally or vertically. Thin rectangles emerge, with aspect ratios of 16 and 36, respectively.

3.2 Algorithm
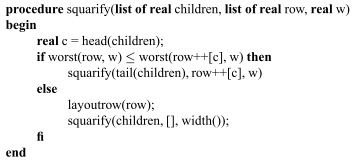
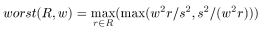
Following the example, we present our algorithm for the layout of the children in one rectangle as a recursive procedure squarify. This procedure lays out the rectangles in horizontal and vertical rows. When a rectangle is processed, a decision is made between two alternatives. Either the rectangle is added to the current row, or the current row is fixed and a new row is started in the remaining subrectangle. This decision depends only on whether adding a rectangle to the row will improve the layout of the current row or not. We assume a datatype Rectangle that contains the layout during the computation and is global to the procedure squarify. It supports a function width() that gives the length of the shortest side of the remaining subrectangle in which the current row is placed and a function layoutrow() that adds a new row of children to the rectangle. To keep the de- scription simple, we use some list notation: ++ is concatenation of lists, [x] is the list containing element x , and [] is the empty list. The input of squarify() is basically a list of real numbers, representing the areas of the children to be laid out. The list row con-tains the rectangles that is currently being laid out. The function worst() gives the highest aspect ratio of a list of rectangles, given the length of the side along which they are to be laid out. This function is further discussed below.
4 Frames
Nesting was introduced by Shneiderman and Johnson [9, 6] to strengthen the visualiza- tion of structure. Each rectangle that represents a non-leaf node is provided with a border to show that its children have the same parent. An example for a binary tree is shown in


5 Discussion
We have presented two extensions to the standard treemaps. First, we have shown how rectangles can be forced to be more square. This gives rectangles that are easier to com-

References
1. A. Bruggemann-Klein and D. Wood. Drawing trees nicely with tex. Electronic Publishing, 2(2):101–115, 1989. 2. S.K. Card, G.G. Robertson, and J.D. Mackinlay. The information visualizer, an information workspace. In Proc. of ACM CHI’91, Conference on Human Factors in Computing Systems, pages 181–188, 1991. 3. R. Chimera, K. Wolman, and B. Shneiderman. Evaluation of three interfaces for browsing hierarchical tables of contents. Technical Report Technical Report CAR-TR-539, CS-TR- 2620, University of Maryland, February 1991. 4. S.G. Eick. Visualization and interaction techniques. In CHI97 Tutorial notes on Information Visualization. ACM SIGCHI, March 1997.5. G.W. Furnas. Generalized fisheye views. In Proc. of ACM CHI’86, Conference on Human Factors in computing systems, pages 16–23, 1986. 6. B. Johnson and B. Shneiderman. Treemaps: a space-filling approach to the visualization of hierarchical information structures. In Proc. of the 2nd International IEEE Visualization Con- ference, pages 284–291, October 1991. 7. D.E. Knuth. Fundamental algorithms, art of computer programming, volume 1. Addison- Wesley, Reading, MA, 1973. 8. G.G. Robertson, J.D. Mackinlay, and S.K. Card. Cone trees: animated 3d visualizations of hierarchical information. In Proc. of ACM CHI’91, Conference on Human Factors in Com- puting Systems, pages 189–194, 1991. 9. B. Shneiderman. Tree visualization with tree-maps: a 2d space-filling approach. ACM Trans- actions on Graphics, 11(1):92–99, September 1992. 10. J.J. van Wijk and H. van de Wetering. Cushion treemaps - visualization of hierarchical infor- mation. In G. Wills and D. Keim, editors, Proceedings 1999 IEEE Symposium on Information Visualization (InfoVis’99), pages 73–78, October 1999. 11. M. Wattenberg. Map of the Market. http://smartmoney.com/marketmap/, Smart- Money.com, 1998.