
Source of information:Материалы XVI международного конгресса по обогащению углей. - Лексингтон (США), 2010.
Screening is an essential stage for several industries processes, emphasizing mining, where generally all the production is submitted to a screening process during the production cycle. Vibrating screens are able to perform the screening operation and are subjected to severe loads due to the drive system and the material behavior. Besides, these equipment need to fulfill the market requirements such as lower costs and delivery time, higher safety and availability. Another important requirement is the higher capacity which results into larger screening surface, hence, wider vibrating screens. It’s known that the increase of a screen’s width significantly increases the difficulty to project the vibrating equipment. In this overview, on one hand theoretical and practical knowledge is necessary to dimension the correct screening surface to guarantee performance and on the other hand, mathematical tools, such as numerical simulation through Finite Element Method, are necessary to guarantee the structural resistance. This work presents an introduction to high capacity vibrating screen application and design. Variables such as stroke, frequency, acceleration, screening surface and their influence in the screening performance will be briefly discussed as well as natural frequency, mode shape, static and dynamic stresses and their influence in the structural design.
Vibrating screens are basically assembled by a robust chassis, composed mainly of steel plates, called the screen box. The screen box is supported by coil springs or rubber mounts and endowed with a drive system and deck(s) (single or multiple screen surfaces). Sometimes an isolation frame is also used to reduce the dynamic force’s transmissibility on to the supporting structure. Generally, vibrating screens are identified by the width and length of screen surface.
Vibrating screens basically have two types of movement: circular (inclined or circular vibrating screens) and linear (horizontal or linear vibrating screens).
In circular vibrating screens, the particle moves through the circular movement provided by the drive system and the deck inclination. The amplitude is given by the radius of the circle made from its movement (stroke is given by the diameter).
The linear vibrating screens were developed in order to decrease the vertical space required by circular screens and to provide better control for dewatering applications. However, besides dewatering, the linear vibrating screens are also widely used in classification. Different from circular vibrating screens, the linear ones are able to transport the material without the aid of gravity given an angle of excitation force of usually 450 with the screen surface. The amplitude is given by half of the trajectory length (stroke is given by whole length).
A good screening efficiency is achieved by the correct dimensioning of screen area, correct choice of media type and correct choice of amplitude and operational frequency in function of the screened material. The particle should move over the screen surface, without hitting the same opening but also, without surpassing several openings. Table 1 presents the recommended frequency in function of mesh opening for linear vibrating screens (Chaves and Peres 2003).
The relationship between the drive system’s force (FC) and vibrating box weight (P) is called the Screen Factor (K). It should have values ranging from 3g to 5g – typically 4g – (HBL 2004). Knowing that the centrifugal force is a function of vibrating mass (m) and centrifugal acceleration (aC); and that the centrifugal acceleration is a function of amplitude (a) and operational frequency expressed in Hz (?) or RPM (N):

At this point, it is important to emphasize that the correct definition of Screen Factor as well as operational frequency and amplitude is based on empirical information related to the screened material characteristics.
Regarding the vibrating screen drive systems, for circular vibrating screens the single shaft with unbal¬anced masses (2 bearings) is the most common. The vibrating screen width is constrained by the shaft length of 2500mm. Over this dimension, the cost becomes impracticable due to the bearing size, shaft's mechanical resistance/dimensioning, distance between decks, etc. The eccentric shaft (4 bearings — positive stroke) has similar constraints to the single shaft screens as to the double shaft screens. However, the latter screen move¬ment is linear due to the counter spin of the shafts. Motovibrators can be used to generate circular or linear movements, but its constructive form (electric motor coupled to counterweights) prevents them from being applied to high capacity screens. These demand higher impact forces, hence higher counterweight mass and motors. Different from the first ones, the exciter drive system does not have the width restrictions, meaning that most of high capacity screens (wider screens) use exciters as drive system (Iizuka 2006).
The main objective of strain gauge measurements is the experimental determination of strain state for any point in the analyzed structure. It is possible that the values of stress, displacement and acceleration provided by the numerical simulation differ from the real values, so the experimental analysis is necessary to optimize the finite element model, decreasing this difference.
Strain gauges are connected to a Wheatstone bridge so when the analyzed component is subjected to loads, the electrical resistance of the strain gauge changes generating an imbalance in the bridge. This imbalance is expressed in a variation of voltage and is proportional to the component s strain.
To perform the correct selection of strain gauge type, factors as ambient conditions (mainly thermal), necessary precision, installation conditions, costs, metal alloy sensitivity, length of strain gauge's grid and other must be considered. Related to the con¬struction form of the strain gauges, three types are the principal ones: uniaxial (applied when principal directions are known with ±5° precision); rectangu¬lar rosette or X rosette (for applications involving biaxial stress conditions with known principal direc-tions) and R rosette (used in applications with biaxial stress conditions with unknown principal directions). In the present work, only R rosette 0745790° will be deeply analyzed because it is largely used in vibrat¬ing screens instrumentation (Hoffmann 1989).
The principal strain (e1, e2, e3) can be defined with Mohr circle aid (Measurements Group 1990), as the Mohr circle angles are twice the physical angles of instrumented surface and superposing the Mohr circle with R rosette axis: (see Figure 1)
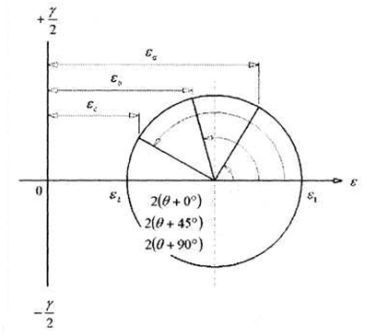

Manipulating the system of equation, the principal strains can be determined in function of strain gauge strains (ea, eb, ec):

Assuming that the analyzed material is homogenous in its composition and isotropic in its mechanical properties and using the linear relationship between stress and strain, Hooke's Law applied to plane strain state can be used to determine the principal stress (a1, a2, c3) through principal strains, as well as von Mises stress.

The usage of von Mises stress (a1) is widely used in Finite Element Analysis because it reduces a six dimension tensor into a simple scalar.
Several mechanical projects, such as vibrating screens, require the computational assistance on both the creation of engineering drawings through CAD software and the structural analysis through CAE software. The design stages (CAD and CAE) generate an iterative process that can be stated before the equipment's manufacture or even before the prototype's manufacture, decreasing significantly the time and costs of the project (Iizuka 2002). To validate the numerical simulation, experimental techniques and tools are applied. CAD software used to create the geometrical model was Solid Edge V20; and CAE software used to perform the structural analysis was MSC.FEA 2007rl, which is an interaction between MSC.Patran (pre- and post¬processor) and MSC.Nastran (solver).
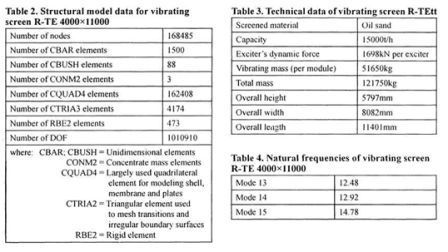
The present work has analyzed the high capacity screen R-TE 4,000*11,000 (4,000mm width per 11,000mm length): modular linear vibrating screen with one deck, driven by 6 exciters. This machine was developed and manufactured by Haver & Boecker Latinoamericana to Syncrude Ltd (oil sand application). Basic raw material are low temperature steel plates with Young's Modulus of 2.1 x 10nN/m2; Poisson's Ratio of 0.3, density of 7.85* 103kg/m3, homogeneous and isotropic.
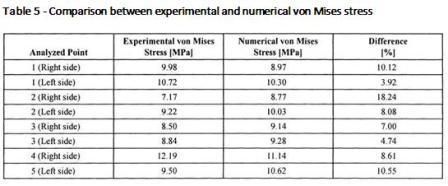
Table 3 presents some technical data related to the vibrating screen R-TE 4000* 11000 and Figure 6 illustrates the vibrating screen. Table 4 presents the results of numerical modal analysis (disregarding the rigid body mode shapes — spring's natural frequencies under 4.00Hz) and Figure 7 presents the results of dynamic analysis expressed in von Mises stress [MPa], in Figure 8, the instrumented points and analyzed elements are presented for latter comparison of results.
The modal analysis is primordial in the development of vibratory equipment. Once the operational fre¬quency gets closer to the natural frequency, there is a dynamic amplification of structure response generating severe efforts (resonance phenomena). The operational frequency of R-TE 4000x 11000 is 11.67Hz (700RPM) and the closest natural frequency is 12.48Hz; historical experimental data performed with the aid of VFD (Variable Frequency Drive) has shown that the current difference of 0.8lHz is enough to avoid resonance effects.
A second analyzed result is the comparison of critical stress in strategic locations between the numerical model and experimental measurements. With exception of Point 2 (Right side), Table 5 shows that all other points have differences below or around 10% (average difference of 8.91%), which is an acceptable limit validating the finite element model. The difference presented in Point 2 resulted from an existent noise in the signal that was discovered during digital filtering of the signal.
In most parts of the analyzed points (62.5%), the von Mises stress of numerical model is higher than the experimental ones due to the fact that the surface elements applied to numerical modeling have a shell behavior. However, in the experimental measure¬ments, the plane strain state is being witnessed. The last two comments about strain gauge measurements are: although this technique has shown extreme flex¬ibility allowing the instrumentation of any part of vibrating box, it requires extreme attention, mainly in conditioning, glueing and wire welding steps so that reliable results are obtained. The correct sample rate following Nyquist Theorem to avoid aliasing, correct selection of filters (low-pass, in the case of screens) and widowing to avoid leakage are also important requirements in strain gauge measurements.
Regarding the maximum stress values, they are below the limits stipulated by specific standards to infinite life fatigue. The von Mises criteria have proven to be practical and useful in the structural analysis.
The present work has also a practical application: the vibrating screen R-TE 4000x 11000 is installed and running at Syncrude LTD. (Athabasca River region, Alberta, Canada), operating over 40,000 hours without any structural problem.
Bathe, Klaus-Jiirgen, 1982. Finite element procedures in engineering analysis. New Jersey: Prentice-Hall.
Chaves, A.P., and Peres, A.E.C., v.3 2003. Teoria e Prdtica do Tratamento de Minerios. Sao Paulo: Signus.
Cook, Robert D., 1989. Concepts and applications of finite element analysis. Madison: University of Wisconsin.
Faco, eds 1994. Manual de Britagem. Sorocaba: Allis — Mineral Systems.
Haver & Boecker Latinoamericana (HBL), 2004. Seminario Nash+HBL. Monte Mor: HBL
Hoffmann, Karl, led., 1989. An Introduction to measurements using strain gauges. Alsbach-Hahnlein: Hottinger Baldwin Messtechnik GmbH.
Iizuka, Eduardo Kenji, 2002. Construcao de model os de elementos finitos e andlise experimental de estruturas mecdnicas. Campinas: Universidade Estadual de Campinas - Mechanical Engineering Dept.
lizando o metodo dos elementos finitos e experimentalmente por extensometria. Campinas: Universidade Estadual de Campinas - Mechanical Engineering Dept.
Measurements Group, 1990. Technical Note — 77V 575—Strain gauge rosettes. Measurements Group. MSC, 2003. NAS120—Linear static, normal model and buckling - Analysis using MSC.Nastran and MSC.
Patran. Santa Ana: MSC.Software Corporation.