Автор: A. Nagakubo, H. Alirezaei, Y. Kuniyoshi
A deformable and deformation sensitive tactile distribution sensor
Abstract
For robots to possess high dexterity and interact
intelligently with objects, a deformable tactile sensor skin which
can also sense the deformation is of great importance. However
conventional tactile sensors are not suitable for this purpose
mostly due to the embedded wiring inside the sensing area.
To overcome this problem, we have implemented EIT (Electrical
Impedance Tomography), a technique based on inverse
problem theory, which can estimate the resistivity distribution
within an electrical conductor by using only measurements
from its boundary. By applying EIT to conductive materials
such as pressure sensitive conductive rubbers, a deformable and
deformation sensitive tactile distribution sensor can be realized.
In this paper, some of the basic characteristics of the EIT
based tactile sensor are reported. Also, we have demostrated
how the conductive rubber sheets can be used with EIT to form
a stretch distribution tactile sensor which detects sophisticated
stimulations such as rubbing and pinching. In the end, we will
introduce our original conductive knit with high stretchability
and low hysteresis, which can easily be implemented over
complex 3D surfaces such as the face and also highly stretching
areas such as the elbow joint.
Index Terms – Tactile sensor, EIT, Inverse problem
1. Introduction
One of the main differences between living organisms and conventional robots is the morphological form of the body surface. Living organisms have soft and deformable skin and at the same time are able to sense multiple tactile stimulations such as light touch, pressure, stretch and heat on their bodies.
Deformation and sensing over the skin have interrelated and cooperative roles. As an example, human hand dexterity is a result of both the skeletal structure of the fingers and the soft and deformable skin. A moderately elastic skin can have results such as enhanced sensitivity, ability to carry out delicate adjustments in both force and position and stabilized passive response. Therefore we can say that skin deformation and tactile sensitivity work cooperatively and enhance the functionalities of one another. Particularly, sensitivity to this deformation in the skin will be important as well as the sensitivity towards external stimulations.
Conventional tactile sensors however, have not been deformable enough to satisfy such demands. This is due to the fact that most of these sensors use wires for collecting signals. Even by using wire-reduction techniques such as the matrix formed wiring, the sensing area will still be filled with crossing wires which reduce the stretchability and deformability of the sensor.
Using small RF devices[13] seems to be the most straightforward technology to eliminate wires inside the sensor specially when combined with two-dimensional signal transmission techniques[14] which is a very interesting and remarkable technology for contactless coupling between electronic medium and sensing devices. However, these approaches have some difficulties such as sensing the skin deformation, implementation over narrow areas, and developing practical electronics.
Vision-based tactile sensors seem to be the only techniques that can realize a deformation sensitive tactile sensor. But embedding cameras and maintaining a necessary distance between the camera and the skin, will greatly restrict the installable locations of the sensor.
To realize a deformable and deformation-sensitive tactile sensor, we introduce a method based on inverse problem analysis which eliminates wires from the most of the sensing area. The inverse problem analysis is used in non-invasive imaging such as the CT Scan(Computed Tomography Scan) in medical imaging. In the case of CT scan, the internal state of the object can be measured by only using measurements done from outside. By using a similar concept, a tactile sensor can be realized which is capable of detecting tactile stimuli inside of an object by using measurements done only on the boundary of the sensing area and therefore eliminating all the wiring over the sensing area.
Before going into details, we show a simplified illustration of this concept in Fig.1.
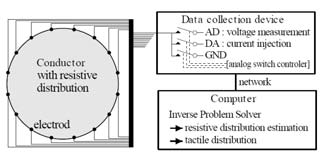
Fig. 1. An example of the system.
The sensor is consisted of a circular PSCR (pressure sensitive conductive rubber) sheet with 16 electrodes on its boundary. These electrodes are used by the sampling circuits only to inject currents and measure voltages. Using These samples taken only at the boundary, EIT(Electrical Impedance Tomography) which is a technique based on inverse problem analysis, can estimate the internal resistance distribution of the conductive sheet.
The PSCR sheet translates pressure distribution over its surface into resistance distribution which implies that pressure distributions can be estimated using EIT techniques. Since most of the sensing area in the sensor is made of rubber sheets without any wirings, a flexible and stretchable tactile sensor can be realized. Moreover, using a conductive material that can translate deformation into resistance distribution, the sensor can become deformation sensitive as well.
In this paper, to verify the potential of a deformable and deformation sensitive tactile distribution sensor based on EIT, we first give a short summary of EIT and then discuss the basic characteristics common to EIT based sensors. Afterwards, a stretch distribution sensor using PSCR sheets is introduced which can detect stimulations such as rubbing and pinching. Finally we discuss sensors based on our original conductive knit material which can be highly stretchable and deformable while exhibiting a rather small hysteresis effect. Comprehensive results on the application of the conductive knit based sensor will be reported in a seperate work [3].
2 Inverse problem analysis
The concept of the inverse problem analysis can be illustrated with the following simple example. Lighting an object from one certain direction will produce a 2-dimensional binary silhouette which only contains a small portion of information from the object’s 3-dimensional shape. However, each extra silhouette captured from a different direction, will increase the total information on the 3-dimensional shape of the object. In other words, using multiple silhouettes from different directions enables one to estimate the shape of the object in a more accurate way.
In a similar way, CT scan reconstructs an image of transmissivity distribution of the body, using X-rays instead of visible light and measuring X-ray photograms instead of the silhouettes. EIT on the other hand, reconstructs an image of the resistance distribution of a conductive body by using electric current and measuring voltages on the boundary. Next, we take a close look at EIT and its most basic characteristics.
A. Electrical Impedance Tomography
EIT has been used since the 1980s mostly in the medical field as a low-cost alternative to CT Scan to create tomographic images of condcutive materials such as the human body. When current is injected into a conductive body using 2 electrodes, the current will flow not only between the 2 electrodes but also over the whole conductive body to form a unique electric potential distribution based on the resistance distribution of the body. Fig.2(a) shows the iso-potential lines for a circular shape cunductive sheet with a uniform resistance distribution when current is injected from two neighboring electrodes. Here, the black points on the boundary represent the electrodes. Assuming the same injection pattern, changes in the resistance distribution of the conductive material will produce different potential distribution on the boundary. This effect is illustrated in Fig.2(b) and (c).
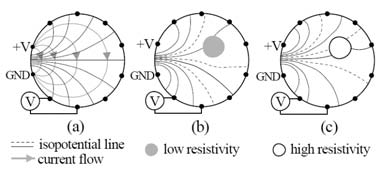
Fig. 2. current injection and potential distribution.
On the other hand, for a same resistance map, independent sets of potential distributions are generated for different current injection electrode pairs. By changing the current injection patterns and measuring the potentials on the boundary, a set of potential data is collected which the EIT solver can then use to estimate the resistance distribution.
B. Data acquisition
In EIT, it is common to place a number of electrodes on the boundary of the conductive material. For each injection pattern, 2 of the electrodes are used for current injection and the rest for potential measurements on the boundary.
The adjacent current injection method is a common sampling method in EIT. Fig.3 shows the adjacent method for a 16-electrode system.
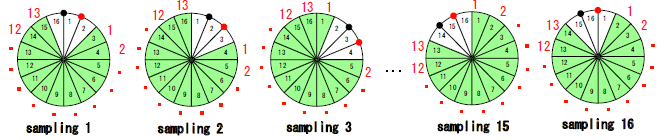
Fig. 3. Data set acquisition: Adjacent method
First the current is injected through electrodes 1 and 2 and 13 differential voltages from every other 2 neighboring electrode pairs are measured. These voltages are the sampled data for the first current injection pattern. the second current injection pattern (through electrode 2 and 3) will yield a second set of 13 differential voltage measurements.
This is repeated up to the 16th current injection pattern in order to form a data set of 208(16x13) differential measurements which is then sent to the EIT inverse problem solver for processing.
C. Image reconstruction
There are a number of image reconstruction methods for EIT such as the back-projection method, layer-stripping method and various iterational methods [4]. In this section we explain the Newton’s iterational method for reconstruction which is the most popular among the available methods.
Assuming ϒi as the resistance distribution, and c as the injected current, Newton’s method minimizes the error in the boundary voltages between those obtained by forward modeling (Vi = F(ϒi, c)) and those measured from the conductive body of interest(Vm). The equation for forward modeling ∇.(σ∇Φ) = 0 is derived from the Maxwell’s equation where σ is electric conductance and Φ is the electric potential. Normally, an FEM (Finite Element Method) model of the conductive body is used for the forward modeling of the problem.
A Jacobian Matrix Ji represents the effect on the boundary voltages for a slight change in the resistivity of the FEM elements. The Jacobian matrix is calculated based on the resistance distribution (ϒi), and is used to estimate a more accurate resistance distribution (ϒi+1 = ϒi + δϒi) which also reduces the error in boundary voltages.
By setting an initial resistance distribution and repeating this iterational process, the estimated resistance distribution map converges towards the true resistance distribution of the sheet. The equation below shows the ith step of the Newton’s method.
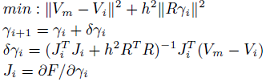
Because of the ill-posed nature of the problem, a regularization term (h2¦Rϒi¦¦2) is also introduced to stabilize the answer. The regularization term contains a scalar weight h and a regularization matrix R which could be the Laplace image prior or in the simplest form could be the unity matrix. Parameter h defines the smoothness of the estimated resistance distribution. High values for h result in soft and flat estimations without much contrasting regions while small values result in sharp but noisy estimations.
D. General facts about EIT
Generally, EIT techniques can be applied to both 2- dimensional and 3-dimensional bodies to estimate their internal resistance distribution.
In this work, we have taken the common practice in 2- dimensional EIT of using 16 electrodes on the boundary of the conductive material. We have also used direct current(DC) for data acquisition and therefore mapped the DC resistance distribution of the material. Of course, the AC resistance (impedance) of the material can also be estimated by using alternating current(AC) for data acquisition.
Although using a circular shape with electrodes placed in equal intervals over its boundary is the common practice in EIT, but theoretically it is possible to handle any custom shape with any electrode pattern. That said, the shape of the conductive material and the electrode placement affects the sensitivity of the system towards changes in resistance. Generally, the system has higher accuracy and sensitivity at places closer to the electrodes.
EIT techniques have also been used in geological imaging of the earth’s interior or for industrial safety measures such as monitoring the amount of gas bubbles in pipes carrying liquids. For more details on EIT, please refer to literatures such as [4].
3. Tactile sensors based on EIT
The concept of using pressure sensitive conductive rubber together with EIT techniques to fabricate thin and flexible pressure sensors is easily perceivable. In fact in 1990 an idea of estimating pressure distribution based on EIT has been proposed which aimed at measuring the body pressure of patients on the bed [5][6]. Basic experiments on pressure sensors using liquid conductive material covered with a flexible membrane have also been reported[7].
However, studies regarding the EIT-based pressure sensors did not follow up because of their lower accuracy and higher computational cost compared to other pressure sensors. In addition, since the above works were introduced in medical publications, they might not have attracted attention of the researchers from other fields.
In robotics however, there are remarkable advantages in implementing the EIT concept for tactile sensors. This is due to the fact that by using EIT, not only thin and flexible but also highly stretchable and deformable tactile sensors can be realized. Moreover, by transforming deformation into resistance change, a deformation sensitive tactile sensor can be realized. Some of the other advantages include the following:
1) Safe interaction: When interacting with humans or the environment, this soft and deformable tactile sensor for robots will prevent possible damage to both parties.
2) Stretch distribution sensor for rich tactile interaction: Most conventional tactile sensors cannot handle tactile stimuli involving skin deformation such as pinching, rubbing. A stretch sensitive tactile sensor enables the robot to detect such rich interactions.
3) Implementation over curved surfaces: Implementing the sensor over surfaces with complex 3D curves such as the face or the joints becomes extremely easy by taking advantage of the sensor’s stretchability.
4) High stretchability: It is not possible for conventional tactile sensors to cover the surface around moving joints such as the elbow or the shoulder because of the high extension in the joint surface area.
5) Detecting multiple tactile stimuli: As the sensor sheet could be extremely thin, by stacking up independent sensor sheets which are each specialized in detecting a different type of stimuli, it is possible to realize a multi-layered sensor capable of simultaneously detecting multiple tactile stimuli.
6) Sensing narrow areas: Since the size of the conductive body is not important in EIT, narrow areas such as the fingertip can also be covered using the sensor.
4. SOFTWARE
We have used EIDORS[8], an open source EIT solver over MATLAB which can calculate the estimated resistance distribution in a conductive body from the input potential data. It provides a number of current injection patterns and basic FEM models of circular shapes.
However, for a more flexible implementation in robotics, tactile sensor modules are preferred to be built in arbitrary shapes with custom electrode layouts. In order to easily model custom shapes and electrode layouts, we have built a GUI environment which imports custom CAD designs of the sensor sheet, generates FEM models, and allows the user to graphically place the electrodes and define the current injection patterns needed.
The software uses the NETGEN[8] meshing engine together with a customized version of EIDORS as the solver and can handle simulations as well as experiment data. For faster and easier simulations, resistance distribution maps can easily be defined using the graphical interface.
Simulation results for three different models in ideal noiseless conditions are shown in Fig.4. Fig.4(a) shows a 2D circular model with uniform electrode layout which is the default model in most EIT studies. On the other hand, models with more complicated shapes and electrode layouts such as the model of Fig.4(b) are not common. However as suggested by the result, this model can still have acceptable sensitivity and accuracy for practical use.
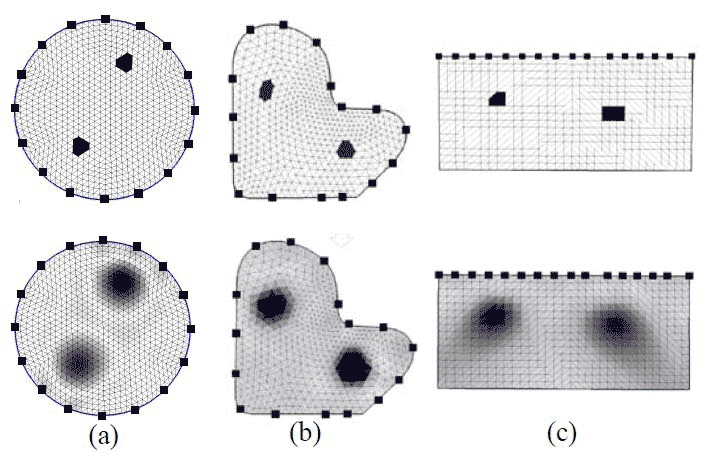
Fig. 4. Simulation results: circular shape(a), custom shape(b) and asymmetric electrode placement(c)
Fig.4(c) shows the simulation results in an extreme example of asymmetric electrode placement which might seem unacceptable.
Resistivity changes are still detectable although moving away from the electrodes, will decrease the sensitivity and accuracy of the estimations. In fact, similar asymmetric models have been used in geophysical tomography.
The simulation results are those of noise-less ideal conditions and the smoothing effect in the results are due to the regularization term which functions in a similar way to a lowpass filter.
5. Basic experiments
In this section, basic experiments on the general sensor characteristics such as sensitivity and resolution are introduced. These results are from an experimental EIT system which can sample the conductive sheet and acquire the necessary potential data. The system has 16 electrodes with 12-bit AD converters where measurements are oversampled 1000 times to achieve higher resolutions. We have used a circular cut of an ordinary conductive rubber sheet ( 1mm thick ) with a non-homogeneous initial resistance distribution in presence of real noise.
A reference resistance distribution map is needed in order to detect the changes in the internal resistance distribution. Fig.5 shows an example of a no-load resistance distribution map used for system calibration.
.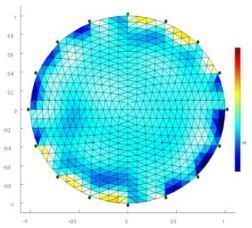
Fig. 5. No load resistance distribution
Due to external stimuli, the internal resistance changes over a certain region inside the conductive material. For these changes to appear in the reconstructed map, the area of this certain region needs to be greater than a minimum.
We have used circular cuts of a silver coated nylon mesh on top of our 16 electrode sensor system so that the resistivity of the area will drop to around zero, a sharp contrast from the rest of the sheet. We then gradually reduced the diameter of the silver mesh to find the smallest detectable silver mesh. The ”minimum detectable area” is defined as the ratio of this silver mesh’s diameter to the diameter of the sensor sheet. Fig.6(a) shows that the minimum detectable area is 8% on the sides and 10% in the center of the sensor. Blues and reds show areas with higher and lower resistivity respectively.
As for the next experiment, we have used circular cuts of the same conductive rubber sheet which is used in the sensor. The ratio of the circular cut’s diameter to that of the whole sensor sheet is 20% and is placed close to electrode 11 and 12. If one additional layer of the same conductive rubber sheet is placed over the sensor, the resistance of the region will drop to half the original value. In the same way, a total of 2 additional layers will reduce the resistance to 33% and the contrast is expected to be more distinguishable. These results are shown in Fig.6(b).
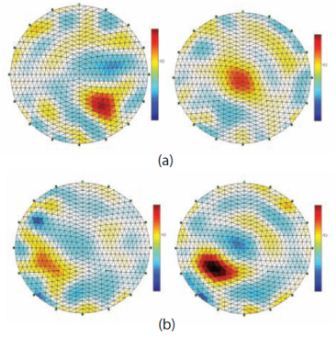
Fig. 6. (a)Minimum detectable area is 8% on the sides(left) and 10% in the center(right). (b)Detectable resistance ratio: 50%(left) and 33%(right)
6. Experiments with pressure-sensitive rubber
We discussed some of the characteristics of the EIT-based tactile systems regardless of the conductive material in use. In this section we will present experimental results which demonstrate pressure sensitive material can be used to detect pressure and stretch. We have used the following two types of pressure-sensitive conductive rubber sheets:
.1) Pressure sensitive rubber sheet A from PCR Technical: Thickness=0.5mm, volume resistivity=0.76 KΩcm.
2) Pressure sensitive rubber sheet B from PCR Technical: Thickness=0.5mm, volume resistivity=14.6 KΩcm.
A. Pressure sensor
Pressure sensitive rubber sheets A and B, show high resistivity changes in the direction of the applied pressure but the change in the horizontal resistivity is relatively small. This means that applying orthogonal pressure over the sheet will not have a big enough effect on the EIT injection currents which flow horizontally.
To increase the horizontal pressure-sensitivity of the sheet we use two layers of conductive rubber. A layer of the pressure sensitive conductive rubber sheet B is placed over the conductive rubber sheet A which has a smaller resistivity compared to sheet B. Multiple spots (5mm x 5mm) of conductive paint with a low resistivity are then sprayed over the top of sheet B with an interval of 1mm. The results in Fig.7(a,b and c) show the experiments using the pressure sensitive material prepared by this method.
This way, at no-load condition, sheet B has a higher resistivity than A while at the time of applying pressure, the resistivity of sheet B will drop below that of sheet A therefore reducing the total parallel resistance of the region. The conductive spots on the top of sheet B, simply transform the change in vertical resistivity into horizontal resistivity.
Fig.7(a) shows the results of applying 1kg and 2kg loads over a circular area with diameter of 20[mm] over the sensor. This demonstrates that changes in pressure distribution over the sensor can clearly be detected. Fig.7(b) demonstrates multiple load points over the sheet which are applied using 3 clamps are to achieve stable pressure application.
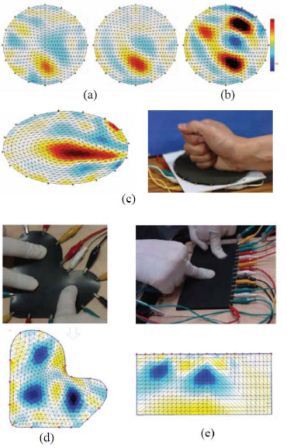
Fig. 7. Pressure distributions: (a) 1kg(left) and 2kg(right)loads, (b) multiple load points and (c) regional contact, (d) custom shape and (e) asymmetric electrode layout.
Also the result for a typical regional contact with the sensor is shown in Fig.7(c) where a closed fist is pressed against on the sensor. Also the use of custom shaped conductive rubber sheets are confirmed in Fig.7(d and e) using an ordinary condcutive rubber and a conductive foam respectively. The blue colors in the results show that the resistance increases as a result of the applied pressure.
B. Porous stretchable sensor
Pressure sensitive rubber sheets are mainly used to measure pressure. However, due to their micro structure, stretching them will also cause a change in the resistance distribution and based on this characteristics of the material, a stretch sensor can be formed. To our knowledge, such stretch distribution sensors were not available in the literature before.
We have used sheet A to generate the results of this section and confirm the possibility of realizing a stretch distribution. Since sheet A is not very stretchable, we have cut holes over it in order to increase its elasticity and deformability and consequently its sensitivity to stretch. The circular holes with a 5mm diameter are cut in 7.2mm intervals. To emulate the softness of the forearm, 4 layers of 5mm thick urethane foam sheets are wrapped around a pipe with 76mm diameter. A circular piece of the porous tactile module is placed over the urethane and fixed using two-sided tapes on the back.
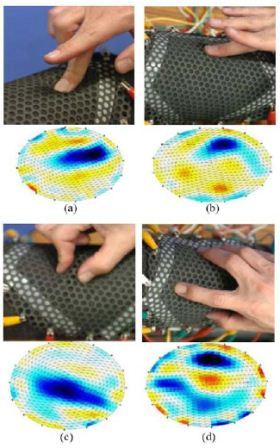
Fig. 8. Experimental results of the stretch distribution sensor.
Fig.8 shows how by using the proposed porous stretch distribution sensor, pushing(a), rubbing(b), pinching(c) and grabbing(d) can be detected (the blue regions on the resistance map). We use the word rubbing to refer to the state where the finger is placed over the skin and pushed horizontally so that slight stretch is caused over the skin.
Detecting a pinch is expected to be relatively easier since pinching causes a relatively bigger stretch over the skin. Even smaller stretches caused by pushing and rubbing are clearly visible in the generated resistance map. In the case of grabbing, the contact points between the finger and the sheet are separately visible.
Conventional tactile sensors are not able to detect rich and sophisticated tactile stimuli such as rubbing or pinching. These results clearly show that EIT based tactile sensor can be used for rich tactile interaction with robots. Also, sensing the amount of stretch will play a fundamental role in realizing highly dexterous object manipulation and natural interactions with the environment.
We also expect that a combination of the porous stretch distribution sensor together with the stretchable pressure distribution sensor from Sec.VII-B will form a very powerful tactile distribution sensor for the robot’s face.
7. Experiments with conductive knit
A reasonable alternative to pressure sensitive conductive rubber, is a special knitted fabric which can be electrically conductive. These conductive knitted fabrics generally have higher stretchability and deformability compared to pressure sensitive conductive rubbers. Conductive knits can be made by directly knitting conductive yarns but also by applying conductive paint over ordinary knitted fabric. Taking the latter approach, we have made our original conductive knit by spraying water based carbonic paint over cotton knit.
A. Basic characteristics
Conductive knitted fabrics can have stretch ratios of over 150%. Stretch sensitivity of conductive knitted fabrics have also been studied and explained[10][11]. The effect of stretch on the conductivity of conductive knitted fabrics is rather conceivable because of the big mechanical change in the composition of the yarns as a result of stretch. However, a less known characteristic of conductive knits is that they can also be pressure sensitive. We have not been able to find research investigating the pressure sensitivity of the conductive knits.
The results of applying pressure to the sensor using our original conductive knit can be seen in Fig.9. Two 300g loads(3N) are placed over the conductive knit which have been clearly detected.
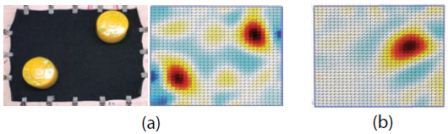
Fig. 9. (a) 2 x 300g weights over the conductive fabric, photo(left) and result(right). (b) 100g weight detected using a multi-layer structure including a highly conductive silver mesh fabric
The sensitivity of the conductive knit is easily adjustable by using a multi-layered structure of highly conductive material and non-conductive meshed material as separator[12]. We have used a loosely weaved non-conductive fabric layer on the top of the conductive knitted fabric and another highly conductive silver plated nylon mesh on the very top in order to increase the sensitivity of the sensor. In no-load conditions, the loosely weaved non-conductive fabric will prevent the silver mesh from making contact with the conductive knit. By applying a force as small as 1N, the silver mesh will touch the base fabric and the resistivity of the associated region will fall to around zero. The 1N force is equivalent to a light touch of the fingers and can be detected as shown in Fig.9(b). This method can be used to realize a touch (on/off) tactile sensor. In addition, by replacing the loosely weaved fabric with tighter ones, we can easily adjust the sensitivity range of the sensor.
It is important to note that another less know benefit of using conductive knits is the extremely low hysteresis of the material compared to pressure sensitive conductive rubbers. Fig.10 shows the results of applying pressure to some conductive rubber materials and compares them with the results obtained from conductive knitted fabric.
Each conductive material is cut into 15[mm] x 50[mm] rectangular pieces and two electrodes are placed on the tips to constantly measure the resistance of the sheet (Fig.11). Applying pressure over the center of the rectangular piece will cause a resistance change without being affected by the contact resistance between electrodes and the sheet, which is plotted in Fig.10.
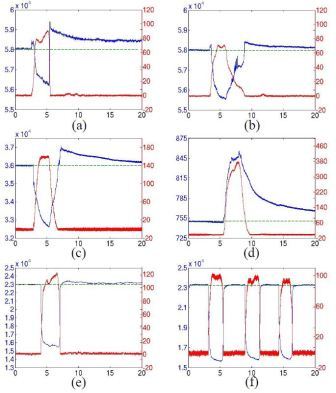
Fig. 10. Investigating the hysteresis effect in different conductive materials. pressure(red) and resistance(blue) vs. time. pressure sensitive rubber (PCR) with fast pressure removal (a) and slow removal (b), normal conductive rubber(c), order-made pressure sensitive rubber(d), and conductive knit with fast removal(e) and in periodic pressure application(f).
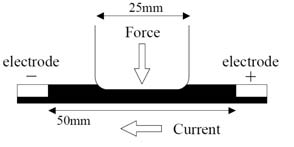
Fig. 11. Experiment device for hysteresis measurement.
In the case of most conductive rubbers, at the time of load removal, the conductivity of the region overshoots to a peak and then restores to the original value. Especially, fast load removal causes large hysteresis while slower load removals causes lower hysteresis. This characteristics of PSCR are not well known. Hysteresis can be widely seen among the conductive rubber material of Fig.10 while the conductive knit fabric shows a very low hysteresis.
B. Complex deformability
To demonstrate the high stretchability and deformability of the proposed sensor we show how it can be used to easily cover up complex 3D curved surfaces and still function as a simple and powerful pressure tactile sensor. We have used a human face prototype shown in Fig.12(a) which has a very complex 3D surface including hollow eyes, nose, lips and chin which all have high curvatures.
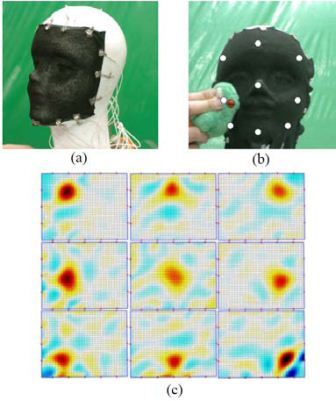
Fig. 12. Example of implementing the sensor over complex 3D surface(face)
The conductive fabric is fixed to the face by using only two-sided tapes on the back of the knit. Although the original shape of the sheet is rectangular, we have completely fit the sheet over the curves by applying stretch whenever necessary. Covering such complex surfaces with conventional tactile sensors is believed to be very difficult. most such sensors have a relatively limited deformability and fixing them over a complex 3D surface, is not trivial.
White spots in Fig.12(b) show the points were pressure is applied over the face. The results of applying pressure to these 9 points is shown in Fig.12(c).
C. High stretchability
Finally, we demonstrate how the conductive knitted fabric can keep its pressure sensing properties even under high stretch.
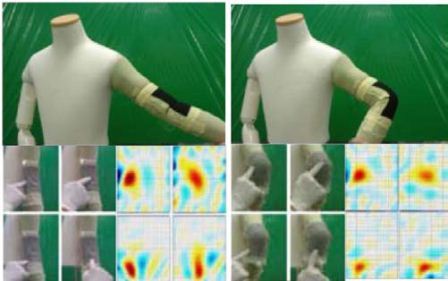
Fig. 13. High stretchability: implementation over the elbow.
A rectangular piece of the original conductive knit (black area in Fig.13) is fixed using two-sided tapes over the dummy’s elbow which has been covered with a soft urethane foam base in advance. Bending the elbow will cause a great deal of stretch up to 150% over the conductive knit. Conversely, fully extending the elbow will cause a few wrinkles over the sensor.
At the bottom of Fig.13, pressure is applied to four different points on the elbow area for the fully bent and fully extended elbow. It can be seen that the four points are clearly detected.
These results simply demonstrate how stretchability and deformability can be used to enhance the functionality of tactile systems. Comprehensive results on the applications of the conductive knit based sensor will be reported in a seperate work [3].
8. Conclusion
To realize a defromable and deformation sensitive tactile sensor, we have introduced EIT, a technique based on inverse problem analysis, which can estimate resistance distribution within the conductive body only from the boundary measuements. Since most of the sensing area contains no wiring, it is possible for the sensor to be made extremely deformable. Also by using conductive material capable of transforming deformation into changes of resistance distribution, deformations over the material can be measured.
We have performed several experiments over EIT based tactile sensors, and have confirmed the following results:
1) Most basic characteristics of the EIT based sensor such as resolution and sensitivity.
2) Pressure distribution images such as multipoints and regional pressuring( the pressure distribution sensor using specially painted PSCR sheet).
3) Utility of custom shaped sensing areas and non-uniform electrode placements.
4) Ability to detect complicated tactile stimulations such as pinching and rubbing( the porous stretch distribution sensor using PSCR sheet).
5) Basic characteristics such as high deformability, lowhysteresis pressure sensing, and the ability of the sensor to be implemented and used over complex curved surface and moving joints (the tactile sensor based on original conductive knitted fabric).
Such a deformable tactile sensor is also very useful for safe human robot interactions, implementation to joint surfaces, implementation to complex 3D curved surfaces and detecting richer and more sophisticated tactile stimuli.
Although the current work mainly discussed 2D deformations such as stretch, but deformations in a 3D conductive body are also measurable using EIT.
For the next stage, we plan to fabricate higher quality conductive knits and also investigate developing other deformable conductive material. We are also planning to consider model correction in EIT based on the sensor deformation.
References
[1] A.Nagakubo and Y.Kuniyoshi : ”A Tactile Sensor based on Inverse
Problem Theory : The Principle” 24th Annual Conference of Robotics
Society of Japan, CD-ROM(in japanese), 2006.
[2] H.Alirezaei, A.Nagakubo and Y.Kuniyoshi : ”A Tactile Sensor based on
Inverse Problem Theory : Basic Experiments” 24th Annual Conference
of Robotics Society of Japan, CD-ROM(in japanese), 2006.
[3] H.Alirezaei, A.Nagakubo and Y.Kuniyoshi : ”A Highly Stretchable
Tactile Sensor Skin for Smooth Surfaced Humanoids” IEEE-RAS 7th
Intl. Conf. on Humanoid Robots, 2007 (to be appeared).
[4] David S. Holder : ”Electrical Impedance Tomography:Methods, History
And Applications” Inst. of Physics Pub. Inc., 2005.
[5] R.A.Knight and R.T.Lipczynski : ”The Use of EIT Techniques to
Measure Interface Pressure” Annual Inter. Conf. of the IEEE Engineering
in Medicine and Biology Society, Vol.12,No.5, pp.2307-2308,1990.
[6] W.S.Fulton and R.T.Lipczynski : ”Body-Support Pressure Measurement
Using Electrical Impedance Tomography” Engineering in Medicine and
Biology Society, in Proc. of 15th Annual Int. Conf. of the IEEE, pp.98-
99, 1993.
[7] M.J.Booth and I.Basarab-Horwath : ”Distributed Pressure Measurement
Using Electrical Impedance Tomography : Initial Results” Advances in
Electrical Tomography, IEEE Colloquim, 1996.
[8] A.Adler and W.R.B.Lionheart: ”Uses and abuses of EIDORS: An
extensible software base for EIT” Physiol. Meas., 27:S25-S42, 2006.
[9] J.Sch?oberl: ”NETGEN An advancing front 2D/3D-mesh generator based
on abstract rules” Computing and Visualization in Science, Vol.1, No.1,
pp.41-52.
[10] H.Zhang, X.Tao, T.Yu and S.Wang: ”Conductive knitted fabric as largestrain
gauge under high temperature” Sensors and Actuators A, Vol.126,
pp.129-140, 2006.
[11] M.Bickerton: ”Effects of fibre interactions on conductivity within a
knitted fabric stretch sensor”, in proc. of Eurowearable 2003, pp.67-72,
sept. 2003.
[12] M.Raibert: ”An all digital VLSI tactile array sensor” in Proc 1984 IEEE
International Conference on Robotics and Automation. Vol.1, pp.314-
319, 1984.
[13] H.Shinoda and H.Oasa : ”Wireless Tactile Sensing Element Using
Stress-Sensitive Resonator” IEEE/ASME Trans. on Mechatronics, Vol.5,
No.3, pp.258-265, 2000.
[14] H.Chigusa, Y.Makino and H. Shinoda: ”Large Area Sensor Skin Based
on Two-Dimensional Signal Transmission Technology” in Proc. of World
Haptics 2007, pp. 151-156, 2007.
[15] K.Kamiyama, H.Kajimoto, N.Kawakami and S.Tachi: ”Evaluation of
a Vision-based Tactile Sensor” in Proc Int. Conf. on Robotics and
Automation(ICRA2004), 2004.