An Infrastructure for Distributed Sensor Data Storage, Retrieval, Processing and Management
Authors: Oleksandr Telyatnikov, Anna Bakshevnikova, Sergey Gimadeyev
Authors: Oleksandr Telyatnikov, Anna Bakshevnikova, Sergey Gimadeyev
Large-scale sensor networks work with numerous sensors that collect information about the real physical world. Sensors generate large amounts of data that can be used in various applications which monitor environmental conditions. For distributed sensor data storage, processing and retrieval such applications need an appropriate infrastructure. We present our approach to its development. We developed an architecture of horizontally scalable infrastructure that allows different service providers to publish their sensors data. Use of standard data format (JSON) and network protocol (HTTP) to access this data from applications allows to develop platform- and programming language independent applications. We describe a prototype of infrastructure implementation based on Hadoop Java framework. Sensors data comes to distributed data storage HBase is transformed into a data representation for applications through aggregating by location or by time intervals. For this data transformations we use Map-Reduce technology. System API gives to service providers opportunities to register sensors and create the data representation for applications. API provides clients with functions of discovering the available observations, retrieving previous periods data and subscribing to stream data. In this paper, we present how our infrastructure handles sensors data streams, performs distributed data processing, discovers available observation offerings and accesses them.
Over the last decades we could see the great development in sensor networks related toWireless Sensor Networks (WSN). In 2009 Gartner reported, “By year end 2012, physical sensors will create 20 percent of non-video internet trafic.” [9]. But not so long time ago the situation with the WSNs resembled the situation with the early days of computing, when the same group of people had been involved in development, maintenance and programming of a system. However, the situation has been changing and there are already academic prototypes and industry platforms, allowing to develop and deploy sensor network applications. Recently there has been signifcant progress in this area. Many low-level problems in this field have already received rather good solution. For example, a whole range of specialized MAC and routing protocols have been produced [15]. Now we have basis for solving higher-level tasks, such as the integration of sensor network applications into web-environment, or simplifcation of context-aware applications development and deployment. Up to this moment a lot of efforts have been made both in science and industry for solving these problems. Management of large-scale networks sets up many challenges related, for example, to energy efficiency of WSNs with great number of hops. One of possible ways to solve these problems is a decomposition of a large network; each small part is operated with its base station integrated into the overall system.
The complexity of developing programs for WSN is one of the barriers for widespread use of sensor network applications. In order to simplify the process of applications development we need to develop a software infrastructure, which could provide sharing sensor data between many consumers and integrating data streams from many sensor networks into one system.
In this paper we suggest a software infrastructure for developing and deployment of large-scale sensor network applications. The infrastructure is intended to simplify the development of context-aware applications that use the information obtained from multiple sensor networks. In order to illustrate the potential of such applications we will consider the following example. Lets assume that young family wants to buy a new house. They find a service that provides information about the environmental situation in the city regions they are interested in. They study materials about air pollution, background radiation and noise level. They study the current characteristics of mentioned factors and their dynamics for the last years. After that with the help of service, which provides information about traffic jams, they study information about traffic congestions at needed time of day and days of week. After that they evaluate the public transport situation with the help of services provided by transport operators. They study the routes and headways of public transport. All these factors are to be taken into account when choosing a place of residence. This example shows that such applications should provide integration of information from many sensor networks, information sharing and storage in observation repository.
This paper makes the following contributions. First, we describe requirements to software infrastructure for large-scale sensor networks (Section 2). It should provide high scalability, information sharing and it should be open. Second, we present architecture of the infrastructure that allows to integrate data streams from many sensor networks, share them to many context-aware applications and perform distributed sensor data processing based on high-level description of services (Section 3). Third, we have developed a working prototype of infrastructure using Hadoop Java framework for distributed storing and processing of sensor data (Section 4). Fourth, we have tested the infrastructure by simulating a sensor network data stream, which has showed its efficiency providing data access and processing of large amounts of previous periods data (Section 5).
Acquisition of knowledge about environment requires the deep analysis of extensive data collected over time and space. Future sensor network applications will have vast number of sensor nodes and will generate a great number of data [20], therefore, technologies for efficient storage and processing of this data are required. In order to achieve an acceptable run-time processing of large amount of data supercomputer level performance is needed. Currently the field of massive data processing is at the stage of transfer from specialized supercomputer architectures to more cost-effective and scalable, but less reliable cluster systems of low-cost x86 servers. In addition, despite of significant growth of storage devices volumes, the speed of data access has changed slightly. This leads to the need of clustering storage for providing an acceptable bandwidth. In order to ensure reliability of data storage excessive replication of data is also required. All these factors indicate that the infrastructure should be scalable.
Sharing a great amount of environmental information from the sensor networks is very important for context-aware applications. The success of the WWW, which allows to integrate and share information from various commercial and nonprofit providers, points that this model can work with sharing information from great number of sensors located in physical environment. Therefore, the developed infrastructure should be open. For developers there should be a possibility to register their sensor network, as it is done in the WWW, where any user can register their site.
For widespread occurrence the developed system should be based on open standards and provide information to applications in a convenient form. At present there are several implementations of middleware for data acquisition. DSware [16], Mires [24] and Impala [17] support event-based data acquisition. They enable event registration, event detection and sending of event notification to interested applications. TinyDB [18], Cougar [26], and SensorWare [5] support query-based data model, use a declarative interface with global level abstraction and database programming For widespread occurrence the developed system should be based on open standards and provide information to applications in a convenient form. At present there are several implementations of middleware for data acquisition. DSware [16], Mires [24] and Impala [17] support event-based data acquisition. They enable event registration, event detection and sending of event notification to interested applications. TinyDB [18], Cougar [26], and SensorWare [5] support query-based data model, use a declarative interface with global level abstraction and database programming
Thus infrastructure for distributed sensor data storage, retrieval, processing and management should be scalable, open and based on open standards.
In this section we describe the architecture of infrastructure for distributed sensor data storage, retrieval, processing and management. In the process of developing we have maintained requirements outlined in the previous section. Use-case analysis says that the system should provide the following actions:
Infrastructure for distributed sensor data storage, retrieval, processing and management is designed to allow service providers to give access to information collected by their sensor networks for various applications. For customers the opportunity for services discovery, access to previous periods information, and subscription for data, which will come in the future, is provided. Figure 1 shows the architecture of infrastructure.
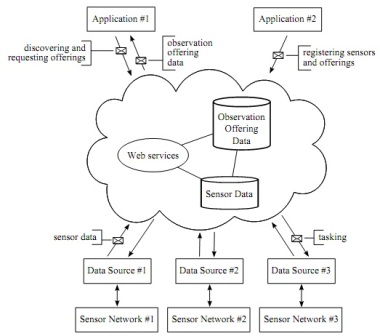
Figure 1. Infrastructure for Distributed Sensor Data Storage, Retrieval, Processing and Management
The system should perform it’s function providing high scalability. Ensuring of a high scalability is related to solving such problems as partitioning and distribution of data between processors, scheduling and load balancing, handling of failures of individual nodes, collection and organization of intermediate results. Direct implementation of these mechanisms significantly complicates sensor network applications development. However, implementation of these mechanisms already exist in the technologies used in high performance Web systems. These technologies originate from Google and they have been developed in order to build a web index, citation index calculation, etc. [3]. There are several open-source projects that use these technologies. In developing of software infrastructure the following technologies are suggested for use: Hadoop File System (HDFS), which is an open source alternative to proprietary Google File System (GFS), and HBase system which is an open source analog of BigTable system [6], running on top with HDFS. This will allow us to develop a scalable data storage that supports distributed processing of large data sets.
We use HBase for distributed data storage. Data is stored in two views: raw sensor data and observations offerings data, where data is stored in prepared for client applications form with observations aggregated across time periods and locations. Transformation of raw sensor data into observation offerings data is performed via MapReduce framework [8]. Using this technology allows us to perform effectively distributed data processing and to create easily observation offerings based on sensors registered in the system. Thus, the system provides distributed execution of features related to services registration on the one hand and discovery and accessing them from the other hand. Also, the system should handle the flow of sensor data. In this case, except simple data saving, they should get into observation offerings, which include a given sensor. In the rest part of this section, we consider these functions.
The system allows service providers to register their sensor networks for storing, processing and providing of access to the data obtained from them. Service registration includes the registration of sensors and observation offerings, which are based on data from these sensors.
Sensor Registration. Users should be able to register their sensors in the system. Sensor registration request should contain the ID, description, information about the location of sensors, sampling period and one or number of observed properties. For each observed property specifies phenomenon and units of measure.
During sensor registration process information about sensor is inserted into the database of the system. In addition, if the sensor is a part of the existing services and data from it must come in the existing observation offerings, the appropriate offerings should be found and references in the sensor to them should be created.
Observation Offering Registration. Observation offering is a tool for creating of sensor data representations necessary for client applications. Observation offering created for a certain locations and provides access to certain observed properties. For observation offerings data is stored in aggregate form: max, min, sum, count. Aggregation occurs across area and time periods. When creating a datasets with average values with the help of MapReduce technology time intervals and averaging periods are used. Data flows in the system for Observation offering registration process shown in Figure 2.

Figure 2. Data flows in the system by observation offering registration
Processing of such a request involves several steps. First we store information about observation offering in the database. Then we scan the registered sensors and link with the offering those that are relevant to it. After that we process the data collected by linked sensors and calculate aggregates on the basis of averaging period for offering and sampling period for sensors. That can be efficiently performed using MapReduce technology.
Service Discovering and Accessing. For client applications, we provide opportunities to discover available services with filtering on area, time interval and observed properties. Information on the appropriate offerings should be sent to the client.
By selecting the required offerings user can get an access to previous periods data by making an appropriate request indicating the necessary time interval. In addition, user can subscribe to stream data of the specific offerings.
Sensor Data Receipt. By receipt of data from sensors they are recorded in the database and sent to all relevant observation offerings. Since aggregates, but not raw sensor data is stored in offerings it is necessary to ensure their calculation. As soon as the calculation of group functions (max, min, sum, count) is finished, the result is stored in the appropriate offering and sent to the appropriate channel for transmission to subscribers (Figure 3).
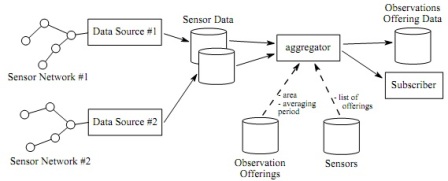
Figure 3. Data flows in the system by receipt of sensor data
In this section we present implementation of the infrastructure. We describe system API and JSON messages syntax that are processed by the system. We describe HBase scheme, which is used to store information about sensors, observation offerings, data obtained from sensors and processed data. Finally, we describe message processing implementation.
Software infrastructure is implemented in Java. Joda Time library that allows us to work with dates, time periods and intervals with ISO 8601 standard support is used to work with date and time. Java Topology Suite (JTS) is used to work with geographic data. JTS is a Java API that implements a core set of spatial data operations. JTS conforms to the Simple Features Specification for SQL published by the OGC [10]. JTS provides Geometry type based on the OpenGIS Geometry Model together with functions of this type. In addition, JTS follows the Dimensionally-Extended 9 Intersection Matrix (DE-9IM) [25] model specified by the OGC. Jackson Java library is used to process JSON data. The remainder of this section is organized as follows. First, we describe the system API specifying the syntax of messages that it handles. Then we present the scheme of HBase tables and describe the software implementation of message processing.
Before proceeding to the description of requests that can be used by applications, we consider formats of information such as spatial location of sensors and observation offerings, time periods and intervals, as well as the observed properties.
Our system uses Well-known text (WKT), a text markup language for representing vector geometry objects to specify location. WKT is regulated by OGC and described in their Simple Feature Access specification [10]. This choice is due to the fact thatWKT is widespread and is used in the following RDBMS Engines: Postgresql with PostGIS Module, Oracle Spatial, MySQL, Informix, Microsoft SQL Server 2008 etc.
ISO 8601 is used to determine time intervals and periods. Time intervals are introduced in format start=end such as “2011-03-08T13:00:00Z/2011-04-08T11:30:00Z”. If the final date is not specified, the default value — current date and time — is used. Format PhdateiThtimei is used to determine time intervals and periods, thus, “PT1M” is a one-minute period [11].
We use the symbolic indication of phenomenon and units of measure to specify the list of observed properties. Units of measure must be defined as a string value in one of two ways: similarly to SensorML [4] (using gml:UnitDefinition to reference online defined known unit definitions, for example, ”urn:ogc:def:unit:OGC:ppm” — parts-per-million) or in Unified Code for Units of Measure (”cm2.s-1” — example for centimeter-squared per second) [22].
Client applications work with the infrastructure by means of message exchanges. Here it is worth considering the contents of the message and actions that might occur in the system when they arrive.
Sensor Registration.Users are able to register their sensors in the system. Request for sensor registration contains its ID, description, sensors location information, sampling period, and collection of observed properties. Phenomenon and units of measure must be specified for each observed property.
The JSON representation of a Sensor Registration message is as follows:
Sensor {
"id" : <id>,
["description" : <description>,]
"samplingPeriod" : <time period in ISO8601>,
"location" : <Geometry in WKT format>,
"observedProperty" : {
<phenomenon> : <uom>
[, <phenomenon> : <uom> ...]
}
}
While processing this query information about the sensor is inserted to a special database table. Then selection of all offerings in this area and shortlisting of those that contain data observed by the sensor take place. Suitable offerings are determined by two criteria: their area should contain the sensor location and their collection of observed properties should contain at least one phenomenon observed by the sensor. The ID of registered sensor is stored for all suitable offerings in database. This is necessary for further data processing received from the sensor.
Observation Offering Registration. Request for observation offering registration should contain ID which is then used in observation offering request and channel identification that is used to transmit stream data. The parameters timeInterval nad averagingPeriod are used to create datasets with time-averaged values. The request must also contain the mandatory parameters area and observedProperty. The syntax of Observation Offerings Discovery request is as follows:
ObservationOffering {
"id" : <id>,
["description" : <description>,]
"timeInterval" : <time interval in ISO8601>,
"averagingPeriod" : <time period in ISO8601>,
"area" : <geometry in WKT format>,
"observedProperty" : {
<phenomenon> : <uom>
[, <phenomenon> : <uom> ...]
}
}
Processing of such request consists of several stages. First, we store the information about the new offering in a special database table. Then we browse through information about all registered sensors and select those that are related to this offering. IDs of found sensors are recorded in the database. After that, it is necessary to process the data collected by selected sensors and calculate aggregate functions (max, min, sum, count) based on averaging period for offering and sampling period for sensors. This can be efficiently performed using technology MapReduce.
Observation Offerings Discovery. Client can browse available offerings, performing filtering by time intervals, area and observed properties. Observation Offerings Discovery request syntax is as follows:
OfferingsFilter {
"timeInterval" : <time interval in ISO8601>,
"area" : <geometry in WKT format>,
["intersectionPattern" : <DE-9IM pattern>,]
"observedProperty" : {
<phenomenon> : <uom>
[, <phenomenon> : <uom> ...]
}
}
While processing the query the system scans all the available offerings and selects those that are suitable for area and observed property and has data for the needed time interval. Then information about suitable offerings is submitted to the client as an array of offerings IDs. Suitable offerings must meet the following conditions:
Offerings Data Request. User can request previous periods data and subscribe to stream data. In the request client must specify the offering IDs what data he wants to get. Necessary IDs can be defined by the previous request. Apart from offerings ID client must specify time interval for which he wants to get observations. The syntax of Offerings Data Request is as follows:
OfferingsRequest {
"timeInterval" : <time interval in ISO8601>,
"area" : <geometry in WKT format>,
"offerings" : <offering ID>
[, <offering ID> ...]
}
Data stored at database and corresponding to the request is transmitted to a client in the form of a list of objects with the following structure:
OfferingData {
"offeringId" : <offeringId>,
"timestamp" : <date and time in ISO8601>,
"data" : {
<phenomenon> :
[<max>, <min>, <sum>, <count>]
[, <phenomenon> :
[<max>, <min>, <sum>, <count>] ...]
}
}
To subscribe to the stream data user specifies offerings IDs, data from which he wants to receive. Comet technology is used to transfer stream data. Comet is a web application model in which a long-held HTTP request allows a web server to push data to a client application without the clients explicit request. For each offering there is the appropriate channel in the system. Subscribing to stream data the user connects to the appropriate channel and gets all the data coming into the channel.
Obtaining Sensor Data. Data from sensors comes in the form of the objects of the following structure:
SensorData {
"sensorId" : <sensorId>,
"timestamp" : <date and time in ISO8601>,
"data" : {
<phenomenon> : <value>
[, <phenomenon> : <value> ...]
}
}
Data received from sensors are recorded in a special database. In addition, all data is forwarded to all relevant offerings. Since it is aggregates that are stored in offerings, not raw sensor data, it is necessary to ensure their calculation. When the calculation of aggregate functions (max, min, sum, count) is finished, results are stored in the appropriate offering and are sent to the appropriate channel for their transmission to subscribers.
Thus, the client messages trigger the following intraactions:
Having defined API system, it is necessary to introduce the database scheme.
Development of the DBMS HBase schemes involves determination of tables, rows, column families and columns.
However, only tables and column families are mandatory.
Here are the main tables:
Sensors — information about sensors and observation offerings to which they belong.
Offerings—information about observation offerings and
sensors related to them.
SensorsData — sensor data.
OfferingsData — data averaged according to averagingInterval and area.
Schema of the main tables is given in Figure 4

Figure 4. Database Schema
Pair phenomenon=uom defines the observed property. Possible symbolic notation of phenomenon and units of measure are described in the previous section.Sensor Registration. When new sensor is registered in the table Sensors general information about the sensor is placed in column family info. The row key is the sensor ID. Observed Properties information is stored in column family property. After that the column family offering is filled where recorded offerings IDs are relevant to the sensor. These IDs are obtained by the Scan operation and their further filtration.
During filtration information from the area is converted to a Geometry object, after which the sensor entry is checked using crosses() method. If the entry is found, then a column with an observation offering ID is added into column family offering, and a column with new sensor ID is added into column family sensor.
Observation Offering Registration. During new observation offering registration to the table Offerings general information is added to the column family info. The row key is the observation offering ID. Observed properties information is stored in the column family property. Column family sensor is filled with sensor IDs relevant to the observation offering by location and observed properties. The observation offering ID is added to relevant sensors. These actions are similar to those that occur during sensor registration. After that it is necessary to calculate previous periods data for observation offering from the available sensor data. This operation is performed with MapReduce Framework (Figure 5).
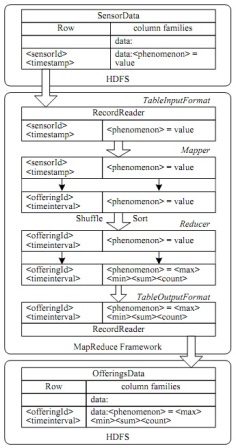
Figure 5. Data flows in the system on observation offering registration
MapReduce operation occurs in four stages: SensorsData table data reading with TableInputFormat class instance; sensor data preprocessing with Map operation; aggregated values calculation with Reduce operation; data recording into the OfferingsData table with TableOutputFormat class. Here is a detailed description of the Map and Reduce operations which perform the whole data processing.
Map operation. Data in the form of pairs key:value (where key is a composite key that consists of sensorId and timestamp when the observation was made and value is the data extracted from the column family data) is extracted from SensorsData table for sensors that enter observation offering calculation. value is converted into an associative array of observations with phenomenon as a key. Map converts the data into other pairs key:value. Here key is a composite key that consists of offeringId and timeInterval. Value of timeInterval is the upper interval bound according to which sensor data is averaged (Figure 6). Values of timeInterval and averagingPeriod for calculated observation offering are used to determine these bounds. hvaluei of the resulting pair is an associative array of observations for those phenomena, which are specified in observation offering.
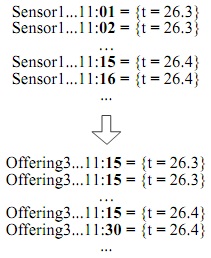
Figure 6. Operation "Map"
When Map operation is finished, we have the data grouped by time intervals in which observations have been made. Calculation of their group functions is carried out by means of Reduce operation. Implicit data shuffling and sorting takes place between Map and Reduce operations. Due to this each server in the distributed processing receives chunks of data containing groups for which aggregate functions will be calculated.
Reduce operation processes all observation groups, obtained from Mapper. Each group is a collection of pairs key:value with the same keys. Reduce operation calculates max, min, sum and count for each group and produces the output with the same key and aggregated values (Figure 7).

Figure 7. Reduce Operation
These values are stored in the OfferingsData table.
Observation Offerings Discovery. For discovering available observation offerings client specifies needed area, observing time interval and observed properties. In the process of search column families info and property are used. If column family property contains at least one of the requested observed properties then the row ID of this offering is included to the list of return values. Time interval of a row must contain interval specified in the request. Column area can be filtered in one of two ways:
1. According to DE-9IM. For this type of comparison
client should specify the intersection pattern, which is
the string that contains an intersection matrix.
2. If intersection pattern is not specified then observed
area should intersect, contain or be contained by requested one to meet the search condition.
The result of discovering is returned to client as a list of
relevant offering IDs in JSON format.
The result of discovering is returned to client as a list of relevant offering IDs in JSON format.
Offerings Data Request. For transfering streamdata we use web applicationmodel Comet, also known as HTTP Server Push, or HTTP Streaming. This technology allows to create persistent connections initiated by the client and kept open until data is available.
Our infrastructure uses Nginx web server with the nginx http push module plugin to implement this model. Nginx server exposes two endpoints: one for the subscriber, and one for the publisher. The client opens long-polling connections to a channel on the Nginx server and waits for data. Publisher POSTs the data in this channel and it is automatically sent to all waiting clients. The server can also perform message queuing, which means that the Nginx server will store intermediate messages if the client is offline. Queued messages expiring may be caused by time or size of the queue.
Each observation offering has its own channel with unique key — offeringId. All the new data in the observa- tion offering is forwarded to the relevant channel and then distributed to subscribers. If there are no subscribers the data may not be deleted immediately but stay a while in the queue. Thus, when clients connect to the channel they re- ceive a small portion of recent observations and then start to receive stream data.
To request data the client specifies the list of needed offering IDs (which may be defined by requesting observation offering discovery) and needed time interval. For storing data in a convenient for applications form OfferingsData table is used. Its row key is a pair offeringId:timestamp where offeringId is ID of the offering that the data comes from and timestamp denotes the time, when the observation was made. The column family data contains aggregated and summarized sensor data.
Processing the offerings data all table rows that refer to requested offering IDs and are extracted into the list of OfferingsData objects with the help of Scan. Then the list is sent to the client side in JSON format.
Obtaining Sensor Data. Data obtained from the sensor is inserted into the SensorsData table. The composite key consists of the sensor ID and timestamp, that denotes the time when information was obtained from the sensor. The obtained values are added into the relevant columns (observed properties) of column family data. If the sensor refers to an observation offering, it is necessary to upgrade aggregated values in the table OfferingsData.
To do this the family column offering is extracted from the table Sensors with the help of get method. Further, values of timeInterval and averagingPeriod of column family info are extracted from the table Offerings. Obtained values of timeInterval and averagingPeriod are converted to Interval and Period objects. Then they are checked with method contains whether the value is in interval from observation offering i.e., whether it is necessary to update the current observation offering. If the value suits the interval, then the upper bound of the interval is calculated to be used as part of row key. After that recalculation of aggregate function for each Observed Property is carried out and the result is stored in the table OfferingsData.
Basing on the implementation that we have described in Section 4 we evaluate a few aspects of the infrastructure in this section.
For to test infrastructure we have deployed Hadoop system in standalone mode on the test server (4 core, 2GB RAM) with Ubuntu Linux and Sun JRE 1.6.0 24. We use Clouderas Distribution for Apache Hadoop (CDH) that includes HDFS, MapReduce framework and HBase. We use CDH3 Beta 4. The infrastructure provides retrieving stream data with the help of Nginx-0.9.5 Web server with nginx http push module-0.692 plugin.
We have developed a web application to test the functionality of our system implementation. A few web pages send http-requests to the server using Ajax technology and then display the responses in JSON format. We have made tests to check all requests supported by the system API.
In our test-bed we used a simulation of 35-node sensor network as a data source. Nodes were sending simulated data with one-second period from two types of sensors: temperature and atmospheric pressure.
Figure 8 shows the screenshot of the web-page with the results of previous periods data request. It selects all datafrom observation offering AirTemperature15Minute for time interval
2011-04-08T00:30/2011-04-11.
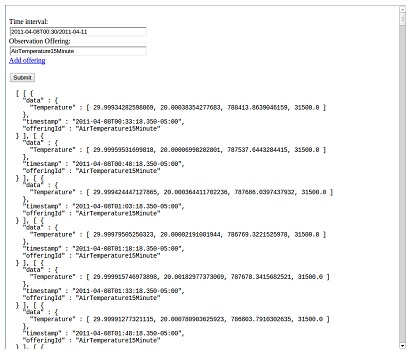
Figure 8. Request for previous periods data
System performance has been tested in the following aspects: the execution time of the MapReduce operation, time of response to a historical data request and time of insertion data coming from sensors of observation offerings set. The evaluation of system performance in the process of calculating time-averaged values for OfferingsData table was made on a large number of sensor data inserted into the database. Each request for observation offering registration triggers theMapReduce operation. Dependence of execution time of this operation on the number of rows in the SensorsData table is shown in Figure 9. Operations has been performed a few times at data size from 100;000 to 3 million records. The graph shows that it is a linear dependence.
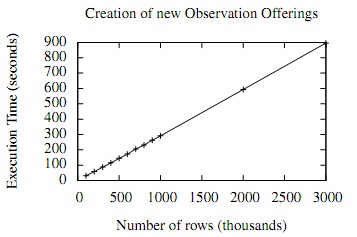
Figure 9. Creation of new observation offering
Time of response to user requests of historical data has been evaluated for different number of records in the OfferingsData table. Dependence is shown in Figure 10. Execution time of these requests can be significantly reduced by using spatial indexes, but in our prototype it is not implemented yet.
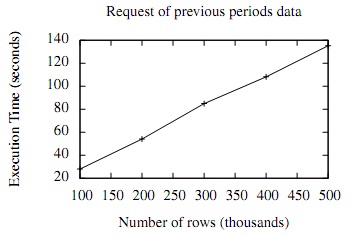
Figure 10. Request for previous periods data
Receipt of sensor data is accompanied with recalculation of the aggregate values of all observation offerings that include this sensor. We evaluate the dependence of this recalculation on the number of observation offerings for sensor (Figure 11).

Figure 11. Calculation of aggregated functions
Evaluating the functionality of our prototype we have demonstrated that there is linear dependence of operations execution time on the volume of data that they are performed on. This means that the developed prototype can be used for further researches, which will test the scalability of the infrastructure in a distributed environment.
Various aspects of our approach to the middleware for large-scale WSNs can be found in other projects. Here we discuss some of the most significant of them.
Global Sensor Networks (GSN) is a platform which provides a scalable infrastructure for integrating of heterogeneous sensor networks [1, 2]. GSN offers virtual sensors as abstraction which enables the user to declaratively specify sensor networks and data streams in a declarative way. Also, GSN provides zero-programming deployment and management support. However, GSN uses its own XML-based language for describing virtual sensors, while our approach provides use of approved Open Geospatial Consortium standard for sensor discovery and processing of sensor observations. GSN is based on a peer-to-peer architecture that supports distributed query processing and distributed discovery of sensor networks. This approach does not fit to WSNs with resource constrained nodes. In contrast to that, we suggest to make the functions of data storage and management of messaging in a separate subsystem, which can run on a scalable cluster.
Sensor Web [7, 13] combines sensor networks with a Service Orientated Architecture (SOA) in order to provide access to heterogeneous sensor resources in a deployment independent manner. A SOA allows us to discover, describe and invoke services from a heterogeneous software platform using XML and SOAP standards. Sensor Web defines the interfaces of Web services for accessing the sensor data and for alerting based on measured sensor dataservices, including Sensor Observation Service (SOS) and Sensor Alert Service (SAS). However SensorWeb does not provide the possibility to work with aggregated data, it is important to network which is important for large-scale sensor networks. Also in contrast to Sensor Web, our infrastructure is focused on distributed storage and processing of sensory data.
SenseWeb Project [12] has been released in Microsoft Research. It allows users to publish sensor data and provides tools to selectively query sensors and visualize data. This project is focused mostly on presentation layer.
In contrast to Nexus project [21], our approach is more highly specialized and focused only on gathering information from the sensors, but does not provide a global, federated model of the world. However, our approach provides the interface for accessing information from the sensors, and can be used as a subsystem for integration of sensor data in global model. Also, the Nexus project uses the request-response model [14]. We suggest to use the publishsubscribe model to access stream data.
Hourglass [23] is an Internet-based infrastructure for connecting sensor networks and applications. Hourglass provides service registration, discovery and routing of data streams from sensors to client application. Hourglass supports in-network filtering and aggregation stream data. In contrast, our system provides an infrastructure for accessing stream data with filtering and aggregation like Hourglass but our system also enables distributed storage, handling and access to large amount of previous periods data.
In this paper we have presented the infrastructure for distributed sensor data storage, retrieval, processing and management. This infrastructure provides services that simplify the development of applications, which use large amount of environmental data. The sensor networks owners can publish their data and create different data representations using the aggregation by time intervals and spatial location of sensors. For processing large arrays of accumulated data we use MapReduce technology that made a good showing in distributed processing of large data arrays in web-systems. For storing data we use the distributed database management system HBase, that allows to handle multiple data streams.
. With the help of that it becomes possible to share data streams and past periods data from numerous sources to multiple applications. Also, the infrastructure enables the integration of data obtained from many sensor networks into a single system. This is necessary for creating large-scale context-aware applications.
In our infrastructure prototype we have implemented only base functionality. We have not paid enough attention to the optimization of requests processing. For acceleration of searching available observation offerings on some area the additional ”index” tables are needed. In future for geographical information indexing the spatial index will be built using geometry grid tessellation and rectangular bounding box. This will allow us to provide higher speed of services discovery and new services registration.
We have been developing the architecture of infrastructure taking into account its future high scalability. All system components have been chosen to reflect this requirement. But the process of testing was carried out not in a distributed system, but in standalone mode. That is why we plan to build a cluster and test the scalability of the system deploying it on a group of machines.