MINIMUM ENTROPY SEGMENTATION APPLIED TO MULTI-SPECTRAL CHROMOSOME IMAGES
Автор: Wade Schwartzkopf, Brian L. Evans, and Alan C. Bovik
Источник: http://live.ece.utexas.edu/publications/2001/ws_icip_2001_mfish.pdf
Автор: Wade Schwartzkopf, Brian L. Evans, and Alan C. Bovik
Источник: http://live.ece.utexas.edu/publications/2001/ws_icip_2001_mfish.pdf
In the early 1990s, the state-of-the-art in commercial chromosome image acquisition was grayscale. Automated chromosome classification was based on the grayscale image and boundary information obtained during segmentation. Multi-spectral image acquisition was developed in 1990 and commercialized in the mid-1990s. One acquisition method, multiplex fluorescence in-situ hybridization (M-FISH), uses five color dyes. We propose a segmentation algorithm for M-FISH images that minimizes the entropy of classified pixels within possible chromosomes. This method is shown to correctly decompose even difficult clusters of touching and overlapping chromosomes. Finally, an example image is given to illustrate the algorithm.
In the 1990’s, new techniques were developed to dye chromosomes with multiple colors so that each B. L. Evans was supported by a US National Science Foundation CAREER Award under grant MIP-9702707. W. Schwartzkopf was supported by a grant from Advanced Digital Imaging Research (http://www.adires.com). chromosome class appears to be a distinct color. This makes analysis of chromosome images easier, not only for human inspection, but also for computer analysis. This research focuses on one such dying technique, known as M-FISH (multiplex fluorescence in-situ hybridization). This work takes advantage of the multi-spectral information in M-FISH images to improve past methods of computer segmentation and analysis of chromosome images.
An image of each fluorophore can be obtained by employing appropriate optical filters. This way, each pixel could be represented as a vector, where each element represents the intensity of the response to one fluorophore. Instead of obtaining a grayscale image by traditional chromosome imaging techniques, such as Giemsa banding [10], a multi-spectral image could now obtained in which the spectral composition at each point reveals the combination of fluorophores and, thus, the chromosome class of the matter at that point. Using this combinatorial labeling, known as M-FISH, one can determine the chromosome class at every pixel.
Such an imaging technique has a couple of obvious advantages. First, the task of chromosome classification is greatly simplified. Instead of determining and then comparing the chromosome lengths, centromere positions, and banding patterns, one only has to look at the spectral information within that chromosome. The second advantage is that it is possible to detect smaller translocations and rearrangements than were discernible with grayscale chromosome banding patterns only [11].

Traditional chromosome segmentation methods use shape information from the boundary of the chromosomes to detect and decompose clusters. Cut points are then found by examining the shape of boundary of the cluster [2, 3, 12]. Occasionally, grayscale information from inside the chromosome clusters is also used. One popular method is “valley searching” [13] where a minimum cost algorithm attempts to locate low gray-value valleys running through the cluster to locate separation between the chromosomes.
With M-FISH images, a new source of information is available for segmentation. If one observes the example in Figure 1, it is not immediately clear, by looking only at the boundary of the cluster, what the proper segmentation of the cluster is. It is not apparent, even to many trained observers, whether there is an overlap involved or even how many chromosomes are included in this cluster. However, the M-FISH multi-spectral information makes it more clear what the proper segmentation should be since each chromosome has its own color.
To use the multi-spectral information available in M- FISH, it is necessary to introduce an objective function that uses this multi-spectral information to evaluate possible cut lines. It would then be possible to examine all possible cut lines, or some reasonable subset of them, and pick the pair that maximizes (or minimizes) this function.
For the objective function, we use a measure of entropy. In particular, we use Shannon’s definition of entropy [14]
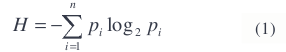
where n is the number of possible classes. In a perfectly classified and segmented image, the entropy of each segment will be zero, since all the pixels in each segment will be classified into the same class. The larger the number of different classes that are found within a segment, the higher the entropy will be.
The probabilities of the classes are calculated empirically. That is, the probability of any class is the number of pixels of that class in an object divided by the number of pixels in that object.
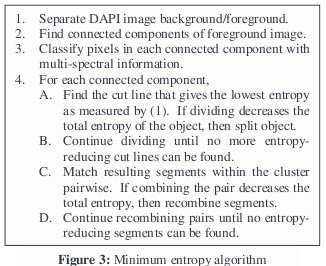
The following algorithm (outlined in Fig. 3), which segments chromosomes using M-FISH multi-spectral data and entropy, was proposed and tested.
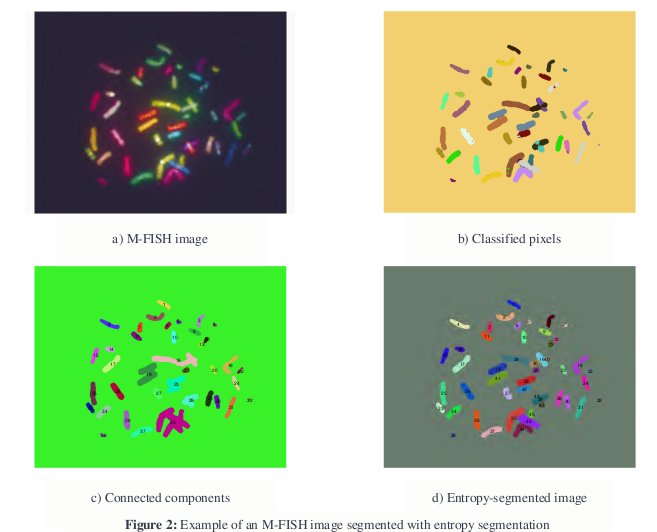
We locate the chromosome material (via thresholding or some other method) an image of a sixth dye, DAPI (4,6- diamidino-2-phenylindole nucleic acid stain), which binds to all chromosomes, and then find the connected components. Next, we label every connected component as a separate object and calculate its entropy. If its entropy is above a given threshold, then we examine that object for possible cut lines.
Initially all boundary points of the object are taken to be possible cut points, where every combination of two boundary points makes a cut line. However, this is a large number of combinations that can be narrowed down. For instance, in order to preserve connectivity, all points in a valid cut line must be contained within the cluster. Furthermore, we can prudently remove a number of other points. Some have suggested using only points of high curvature along the boundary of the cluster [3].
We consider only points whose cut line was contained within the chromosome clusters and had an 8-connected neighbor whose class differed from theirs. We also require that the cut line not result in a division whose size was smaller than a certain threshold. This avoids the removal of single pixels, whose entropy is always zero, as well as other small sections of noise along the boundary.
Candidate cut lines are made by straight lines between all combinations of candidate cut points. For each candidate cut line, we calculate the entropy of the resulting division. If the sum of the resulting entropies is less than the entropy of the original cluster, then the cut line is considered valid. We choose the valid cut line that results in the least total entropy. If no valid cut lines exist, then the object is not divided. If a valid cut line is found, we remove the points in the optimal cut line from the object so that the two divisions are no longer connected. These two divisions are then considered two new objects. We then examine the two new objects and entropies to see if these new objects need to be further divided.
Once all entropy-reducing divisions are made, we recombine objects that may have been labeled as separate objects due to overlap. To do this, we combine all objects within a cluster in pairs. If the entropy of any pair is greater than the sum of the entropies of the two individual objects, we label the combination as valid. We choose the combination that yields the lowest entropy. After these two objects are combined, we examine the cluster again, using the same method to look for other objects in it that need to be combined. If no valid combination is found, the algorithm stops and moves to the next cluster.
[1] C. Lundsteen and J. Piper, Automation of Cytogenetics, Berlin, Springer-Verlag, 1989.
[2] J. Liang, “Intelligent Splitting in the Chromosome Domain,” Pattern Recognition, vol. 22, no. 5, pp. 519-532, 1989.
[3] G. Agam and I. Dinstein, “Geometric Separation of Partially Overlapping Nonrigid Objects Applied to Automatic Chromosome Classification,” IEEE Trans. Pattern Analysis and Machine Intelligence, vol. 19, no. 11, pp. 1212-1222, 1997.
[4] D. Pinkel, T. Straume, and J. W. Gray, “Cytogenetic analysis using quantitative, high-sensitivity, fluorescence hybridization,” Proc. National Academy of Sciences of the United States of America, vol. 83, pp. 2934-2938, 1986.
[5] P. M. Nederlof, S. van der Flier, J. Wiegant, A. K. Raap, H. J. Tanke, J. S. Ploem, and M. van der Ploeg, “Multiple fluorescence in situ hybridization,” Cytometry, vol. 11, pp. 126- 131, 1990.
[6] P. M. Nederlof, S. van der Flier, J. Vrolijk, H. J. Tanke, and A. K. Raap, “Fluorescence Ratio Measurements of Double- labeled Probes for Multiple in Situ Hybridization by Digital Imaging Microscopy,” Cytometry, vol. 13, pp. 839-845, 1992.
[7] M. R. Speicher, S. G. Ballard, and D. C. Ward, “Karyotyping Human Chromosomes by Combinatorial Multi- fluor FISH,” Nature Genetics, vol. 12, pp. 368-375, 1996.
[8] M. M. Le Beau, “One FISH, two FISH, red FISH, blue FISH,” Nature Genetics, vol. 12, pp. 341-344, 1996.
[9] T. Ried, A. Baldini, T. C. Rand, and D. C. Ward, “Simultaneous visualization of seven different DNA probes by in situ hybridization using combinatorial fluorescence and digital imaging microscopy,” Proc. National Academy of Sciences of the United States of America, vol. 89, pp. 1388-1392, 1992.
[10] M. Seabright, “A rapid banding technique for human chromosomes,” Lancet ii, pp. 971-2, 1971.
[11] T. Veldman, C. Vignon, E. Schröck, J. D. Rowley, and T. Ried, “Hidden chromosome abnormalities in haematological malignancies detected by multicolour spectral karyotyping,” Nature Genetics, vol. 15, pp. 406-410, 1997.
[12] Q. Wu, Automated Identification of Human Chromosomes as an Exercise in Building Intelligent Image Recognition Systems, Catholic University of Leuven, Leuven, Belgium, Doctoral Dissertation, 1987.
[13] A. M. Vossepoel, Analysis of Image Segmentation for Automated Chromosome Identification, University of Leiden, Leiden, Netherlands, Doctoral Dissertation, 1987.
[14] C. E. Shannon, “A Mathematical Theory of Communication,” Bell Sys. Tech. Journal, vol. 27, pp. 379-423, 623-656, 1948.
[15] http://www.aicorp.com