
Abstract
Content
- Introduction
- 1. Theme urgency
- 2. Goal and tasks of the research
- 3. Overview of existing methods, models, algorithms
- 3.1 Overview of diagnostic methods of ventilation equipment
- 3.2 Overview of methods for forecasting multivariate time series
- 3.2.1 The mathematical formulation of the problem
- 3.2.2 The SSA algorithm
- 3.3 Overview of planning repairs
- 4. Overview of existing software
- Conclusion
- References
Introduction
Ventilation systems include groups of all kinds of equipment: first of all, it's fans, fan heaters and ventilation systems. Among the accessories — silencers, air filters, electrical, and water heaters, regulators, and air diffusers, etc. Used fans are axial type, ie contain blades that move air along the axis they revolve around. They are driven by a three-phase asynchronous motors.
Nowadays, diagnosis of the equipment, and, therefore, prediction of failures, carried out as follows: an engineer with the vibrator takes the spectrogram of vibration signals from the fans (and their components, such as bearings) and analyze them. Detection of electromagnetic defects (arising in motors and generators) is much more difficult procadure because, except for simultaneous removal of the spectrograms of six vibration signals spectrum analyzer with very high resolution, with the number of spectral lines, no less than 3200, with maximum engine load, is usually necessary to make measurements of currents in the windings of electrical machines [1].
1. Theme urgency
Because the safety of workers at the mine depends on the serviceability of ventilation equipment, the problem of predicting its failure is a priority.
Development of this system will allow better analysis of failures to detect them as soon as possible. This will provide increased safety of the mine, and it will make possible time planning of preventive repairs and purchases of new equipment.
2. Goal and tasks of the research
The goal of the research is the creation of a subsystem, which allows to predict failures and schedule repairs mine ventilation equipment.
Main tasks of the research:
- Analysis of existing methods, models, algorithms that are used to solve the problem.
- Overview of existing software implementing the required functionality.
- Design and development of this subsystem.
- Testing the system.
- Optimization the model and algorithm parameters.
Survey item: diagnostic process of ventilation equipment.
As a part of the master's work planning to obtain the actual scientific results in the following areas:
- Developing an algorithm allowing to diagnose various ventilation groups with the lowest system resources using.
- Developing a prediction algorithm for multivariate time series for estimation of the smooth operation of the equipment.
3. Overview of existing methods, models, algorithms
Today, there are a number of diagnostic equipment methods, ranging from the widely applied in the 70th years of XX century, the parametric analysis methods that are significantly susceptible to the influence of human factors, to the modern methods of nondestructive testing [2].
3.1 Overview of diagnostic methods of ventilation equipment
Methods of nondestructive testing can diagnose the equipment without removing it from work and dismantling. By these methods include:
- Vibrational.
- Ultrasonic.
- Radiation.
- Acoustic.
For the diagnosis of ventilation equipment, as a rule, use the method of acoustic and vibration diagnosis method because together they are sufficiently accurate and do not require expensive equipment [3].
There are many methods of vibration diagnostics (Shock Pulse Method — SPM, Evaluated Vibration Analysis Method — EVAM etc.), are usually combined to produce the best results [4]. The choice of method depends on the basic mechanism that is required to diagnose whereas it is necessary to take into account the characteristics of its operation. The difference between the SPM shock pulse and vibration seen in Figure 1.
Figure 1 – The difference between the SPM shock pulse and vibration
At the initial moment of contact of bodies in contact molecules produce shock waves that propagate in the materials of both bodies. The amplitude of a shock — is a function of speed collision of bodies, it does not depend on their mass and shape. The SPM method analyzes the first event — the shock pulse propagating in the material. Further, due to elastic deformation occurs damped vibration of the bar depending on the velocity, mass and shape of the contacting bodies. The method of measuring vibration analyzes the second event — vibrational oscillations of the body [4, 5].
Thus, the input information subsystem is a set of spectrograms of vibration signals taken at different points. To solve the problem of predicting equipment failure to construct a forecast of the original series, which leads to the problem of forecasting multivariate time series.
3.2 Overview of methods for forecasting multivariate time series
Existing methods of forecasting multivariate time series can be divided into the following groups [6]:
- Statistical methods. These include simple methods for constructing a forecast based on the mean value for a certain period. Methods have low accuracy, since it does not take into account the presence of trend, seasonality, abnormal emissions from the source data.
- Regression methods. This group of methods, including their own regression methods, include methods of autoregressive and their modifications, such as an integrated model of autoregressive – moving average (ARIMA). These methods are more accurate than the statistical methods, but also are unstable in the release. Usually, before using these methods is the reduction dimensionality of the problem with one of the existing methods, such as principal component analysis, discrete cosine transform, fast Fourier transform, factor analysis and other [7]. But in the reduction of the dimension of this problem will lead to the loss of a certain amount of information that is not valid.
- Wavelet transform. At the core of this group of methods is the main property of wavelets - the possibility of analysis of the various frequency components of the series. At present, data are used to convert forecasting univariate time series, as well as all of the above methods. Mathematics, allowing multi-dimensional analysis of the series is still under development. It should be noted that choosing wavelet function is also a challenge [8, 9].
- Neural network model. Are a powerful and flexible tool for prediction of multidimensional time series, since the structure of the neural network can be changed depending on the type of the equipment. Disadvantages include needs of a sufficiently large number of data for network training [9], which can be difficult in the case, for example, installing a new hardware.
- Genetic Algorithms. The learning algorithm LGAP (Learning Genetic Algorithm for Prognosis) is based on the idea, previously used in the algorithms ZET and WANGA, usually used to fill gaps in the empirical data tables. The algorithm without drawbacks of the algorithms described above, but requires a large number of system resources for its work. The algorithm is easily parallelized and shows good results when working on multiprocessor systems [10], but this solution is very costly.
- The singular time-series analysis (SSA). Nowadays a modification, called a "caterpillar", is usually used. It can easily be generalized to any number of dimensions. This algorithm is a two-parameter (defined by the length of the caterpillar and the number of its components). The choice of parameters has a significant influence on the result, as well as the time of the algorithm working. Notably the stability of the algorithm to emissions, which is an important consideration the problem, since the sensor measures the vibration signal spectrogram is a very sensitive device. It works well with the prediction of non-stationary time series [11, 12]. This is also an advantage.
Thus, the most suitable method for solving this problem is the SSA algorithm.
3.2.1 The mathematical formulation of the problem
There is a system of functions ![]() , where
, where
k – the number of time-series. k = 1 .. s.
s – the amount of time-series.
N – the length of time-series.
i – the number of reference.
The time-series is the spectrogram of the vibration signal, taken at a certain point.
Requires expande the time-set in a sum of components, interpret and construct each one and make the continuation of a time-set ![]() using selected components.
using selected components.
3.2.2 The SSA algorithm
As a result of the method the time-set is decomposed into a number of simple components: trend, seasonal, periodic, and oscillatory components and noise components. The resulting expansion can serve as a prediction for the number of the whole set and its individual components.
The algorithm consists of three steps:
- Constructing the matrix of observations.
- Principal component analysis.
- Forecasting.
For simplicity we consider one-dimensional time series ![]() .
We choose n such that 0 < n < N - 1 – caterpillar’s lifetime. Let
.
We choose n such that 0 < n < N - 1 – caterpillar’s lifetime. Let ![]() – caterpillar’s length.
We construct a sequence Z of n vectors in space
– caterpillar’s length.
We construct a sequence Z of n vectors in space ![]() of the form:
of the form:
We call Z the noncentered matrix of observations. In the case of multi-dimensional time-series the matrix is a column of matrixes of the observations corresponding to each component.
Consider the covariance matrix of the received samples:
Then we do its singular value decomposition (SVD):
Next, considering a system of principal components:
After analysis, it is necessary to restore the matrix of observations using the main components:
Then restoring the original sequence:
Then the forecasting begins. Time-set ![]() is a continuation of a set
is a continuation of a set ![]() , if the generated sample in the caterpillar
processing lies in the same hyperplane as the original series does. Previously, we calculated the set of principal components
, if the generated sample in the caterpillar
processing lies in the same hyperplane as the original series does. Previously, we calculated the set of principal components
![]() . We define:
. We define:
We also define:
Then the predicted value at the point N + 1 calculated by the formula [13]:
An example of predicting the three one-dimensional time series is shown in Figure 2 [14].
Figure 2 – Prediction of time-series using SSA algorithm (Animation: 6 frames, number of reproduction cycles is not limited, 10 Kb)
3.3 Overview of planning repairs
Ways of planning for maintenance and repair services are classified as follows:
- At the event — for example, the removal of equipment failure, is used if the cost of repair is relatively low then a marriage of products, which is the result of equipment failure, and will not affect the fulfillment of obligations to customers.
- Routine maintenance — for equipment with prescribed regimes and regulations service initially involves regular use of appropriate measures to maintain performance, this kind of service gives the highest percentage of availability of equipment, but it is also the most expensive, because the real condition of the equipment may not require repair.
- By needs — by an expert or by meters installed on the equipment carried assessment of the equipment, and on the basis of this assessment is a forecast, when the equipment should be shown in the repair. The advantage of this type of service: it costs less, and the readiness of the equipment to carry out production programs is high.
All scheduling methods can be divided into several groups:
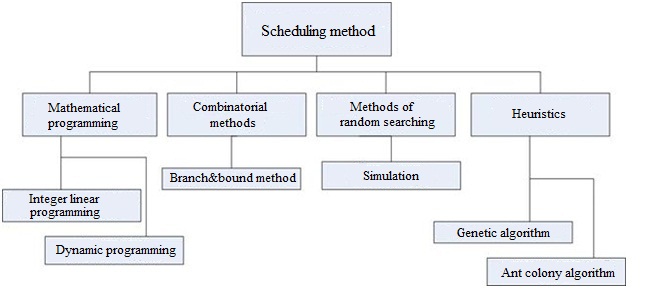
Figure 3 – Scheduling methods
Analysis of the methods showed that the complexity of using a combinatorial method and the method of dynamic programming related to the the exponential growth of computing duration when the number of dimensions of the problem grows. In addition to the problems scheduling at each step of planning the system of constraints changes. This makes the using of the simplex method, as part of the branch and bound method, inefficient. Using the simulation requires a large amount of statistical data accessed at the mine is usually difficult. Thus, the most promising will be the choice of heuristic methods. Currently, there’re many heuristic methods based on the application of genetic algorithms and their modifications allowing to find near-optimal solution of the scheduling problem with limited resources [15].
Overview of existing software
Currently, there are several systems similar to the projected, for example:
- DREAM-E package, developend by «VAST» (St. Petersburg) [16].
- CMM system, developend by joint-stock company "SPM Instrument St. Petersburg" [17].
Both systems are designed for continuous monitoring and diagnostics of equipment and have similar functionality. The disadvantages of these systems are:
- Considering only the information from the sensors.
- Paing respect to the only one, the most probable defect.
- This software is available after payment of, respectively, it is difficult to assess its quality.
- The high cost.
Conclusion
To date, one of the most important practical industrial problems is to ensure reliable operation of the equipment. Not only economic indicators of the company, but also the safety of workers depends from the correct desicion of the problem.
Insufficient using of stationary systems of preventive diagnosis is usually determined by financial or organizational reasons. Typically, the deep diagnosis systems mounted on the unit after several years of work when the number of equipment failures is beginning to increase. Such systems are not staff and their safety during the repair work on units does not provide by documentation of mine maintenance and by the units’ repairing standards.
The development and implementation of the designed system will reduce maintenance costs and improve the safety of workers of the enterprise.
As part of the research carried out:
- The main algorithms that can be used to solve the problem are choosed based on the analysis of the literature highlights .
- Completed search for existing software packages that implement the required functionality.
This master's work is not completed yet. Final completion: December 2012. The full text of the work and materials on the topic can be obtained from the author or his head after this date.
References
- Барков А.В. Основные требования к современным средствам мониторинга состояния и диагностики машин и оборудования / А.В. Барков. — М:2011. — 716 с.
- Сараев А. Д. Системный анализ и современные информационные технологии / А.Д. Сараев, О.А. Щербина — Симферополь: СОНАТ, 2006. — 486 с.
- Клюев В.В. Неразрушающий контроль: Справочник: В 7т. / В.В. Клюев. — М:2005. — Том 1. - 616 с.
- РТМ 07.03.004-83 «Методика вибродиагностики подшипников качения опорных узлов шахтных вентиляторов главного проветривания» - М:1984. — 284 с.
- ДНАОТ 1.1.30-06.09.93 «Руководство по проектированию вентиляции угольных шахт» - Киев, 1994. — 311 с.
- Хеннан Э. Многомерные временные ряды / Э. Хеннан. — М.: Мир, 1974. — 576 с.
- Большаков А.А. Методы обработки многомерных данных и временных рядов / А.А. Большаков, Р.Н. Каримов. Учебное пособие для вузов — М.: Горячая линия — Телеком, 2007. – 522 с.
- Nason G.P. The stationary wavelet transform and some statistical applications / G.P. Nason, B.W. Silverman — N.Y.: Springer, 1995. — 464 p.
- Шибалкин А.А. Прогнозирование временных рядов с использованием многослойных нейронных сетей и вейвлет-преобразований / А.А. Шибалкин, М.В. Марковский — М.: Научная сессия МИФИ – 2008. — Том 11. — 412 с.
- Загоруйко Н.Г. Прикладные методы анализа данных и знаний / Н.Г. Загоруйко — Новосибирск: ИМ СО РАН, 1999. – 270 с.
- Keppenne C. Complex singular spectrum analysis and multivariate adaptive regression splines applied to forecasting the southern oscillation / C. Keppenne, U. Lall – Exp. LongLead Forcst. Bull, 1996. – 684 p.
- Elsner J. Singular Spectrum Analysis. A New Tool in Time Series Analysis. / J. Elsner, A. Tsonis — New York: Plenum Press, 1996. - 163 p.
- Прогнозирование временных рядов методом SSA. [Электронный ресурс]. – Режим доступа: http://www.machinelearning.ru/....
- Метод гусеницы [Электронный ресурс]. – Режим доступа: http://www.gistatgroup.com.
- Ковалев М.Я. Модели и методы календарного планирования / М.Я. Ковалев. — М:2004. — 447 с.
- Вибродиагностика, мониторинг [Электронный ресурс]. – Режим доступа: http://www.vibrotek.ru.
- SPM Instrument [Электронный ресурс]. – Режим доступа: http://www.spminstrument.ru/.