International
Conference on Computer Systems and Technologies - CompSysTech’
2005
Structural analysis and methods for
development of software tool for design
and energy simulation of PV- hybrid power supply systems in poultry
farms
Katerina Gabrovska, Angel
Smrikarov
Abstract: A paper presents
the basic stages of developing a software product RES v.1.0 for design
and
energy simulation of photovoltaic hybrid installations as an auxiliary
power
supply systems for poultry farms. Used structural analysis of a
programme is
described in details through Data Flow Diagrams. Also the
classification of the
most famous software systems for design and analysis of alternative
energy
devices is made and the position of developed software RES v.1.0 among
them is
shown.
Key words:
Structural analysis, Data Flow Diagrams, Energy software simulation,
Classification.
INTRODUCTION
In the last years the application of
renewable energy
sources (RES) in electricity supply systems rapidly increase. The
limited
resources and high cost of conventional energy sources (oil, gas,
coal), as
well as the continued environmental pollution are some of the main
reasons for
their widespread introduction in electrical power systems. Development
and
usage of these alternative energy technologies are still restricted in
Bulgaria.
Software products (such as PVS, PVSYST), using for projecting and
research of alternative
energy systems in our country are usually developed by European or
American research
centers or products supplying companies. The need for specific software
product
for projecting, analysis and simulation of electric power processes in
technological buildings with specific electrical control exists. The
electrical
power supply in them is divided into conventional and alternative
energy
supply. This paper presents structural analysis and mathematical
methods for
design and development of the software system for sizing, analysis and
energy
simulation of photovoltaic (PV) hybrid electrical system, used for
electric
power supply of poultry house. The main key features of developed
software are
pointed in comparison with other well-known products.
LAYOUT
The aim of present research is working
out a
structural analysis and methods for software system RESs development. A
programme can be used during the process of design, sizing, energy
analysis and
simulation of electrical power processes in PV-hybrid system for energy
supply
of poultry farm.
The following problems have been solved:
- Composing a basic stages of the
mathematical
modeling, which is needed for software system development;
- Accomplishment of a structural
analysis and
description of its results through a Data Flow Diagrams (DFDs);
-
Defining
a proper place of developed programme among the most popular software
systems
of same type by means of a table of classification. Describing the
specific performances
and advantages of presented software tool in the aspects of current
research.
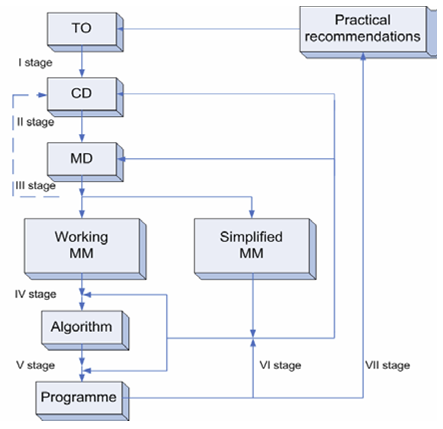
The performed steps during a
mathematical modeling of
designed PV-hybrid installation, which is implemented in developed
programme,
are shown on the following flow-chart:
Fig.1 Flow-chart with a basic
stages of chosen mathematical modeling for design and analysis of a
studied
technical target
Informal transition from observed technical object
(TO) (PV-hybrid fitting
for electric power supply of breeding farm for broilers) to its
appropriate contextual
diagramme (CD), also named model of conception
(CM), is fulfilled at a first stage. Here is emphasized on these working
features,
particularities and operational conditions of TO, that had to be
mentioned in
the CM by means of specific technical parameters. The correct and
comprehensive
recognizing of technical object characteristics in CM is a substantial
premise for
future retrieving reliable mathematical modeling results. Also a
typical
climate of explored geographical region and electric power supply of
selected
building (a breeding house), characterized with hour, daily and week
schedules
of its electrical loads, are considered as other main technical targets
during
the software system development.
Second step is a formal mathematical description of
CM through mathematical models
(MM) of the meteorological
processes, electric power flow in designed PV-hybrid equipment and
electric
power consumption in a poultry house. At a third stage of modeling is implemented a qualitative
and
evaluation analysis of a built MM. The inconsistencies sometimes arise
and that
requires further precisely revision of CM (dotted line on Fig.1). Forth step represents the construction of effective algorithm
of computational
experiments, and a fifth stage – the creation of working programme, which implements that algorithm.
Derived at a sixth stage (from software system) processed results
are verified
with a help of data, which are obtained as results from quantitative
analysis
with simplified version of MM of a TO. At the end of testing the
failings in a programme
or in algorithm, or in both can be found. After analyzing the
calculated results
and their interpretation occasionally is needed a reformation in CM and
its
corresponding MM. After failing eliminations, a triad
“model-algorithm-programme” can be used for
carrying out the computation
experiments and formulating practical recommendations for TO improvement on the base of
retrieved
quantitative information. These procedures compose the seventh,
final stage of
“technological flow” of mathematical modeling and
software development.
o Structural analysis before the
implementation of
software system RESs v.1.0 for automation of design and energy
simulation of
alternative electric power installation In a process of structural
design of a
software, Data Flow Diagrams (DFDs) are used for tracing the network of
data
streams in a system and for providing information at different levels
of
significance [2]. Thus the system demands can be divided, analyzed and
specified
in control units. DFDs allow a system to be structured in the
independent modules.
A model of conception is described through DFDs at different levels. A
DFD on level
0, which shows a general programme structure and is the highest level
of
analysis, is graphically presented on Fig 2. A numbering from 0 to 12
for the
basic system processes of DFD level-0 is used.
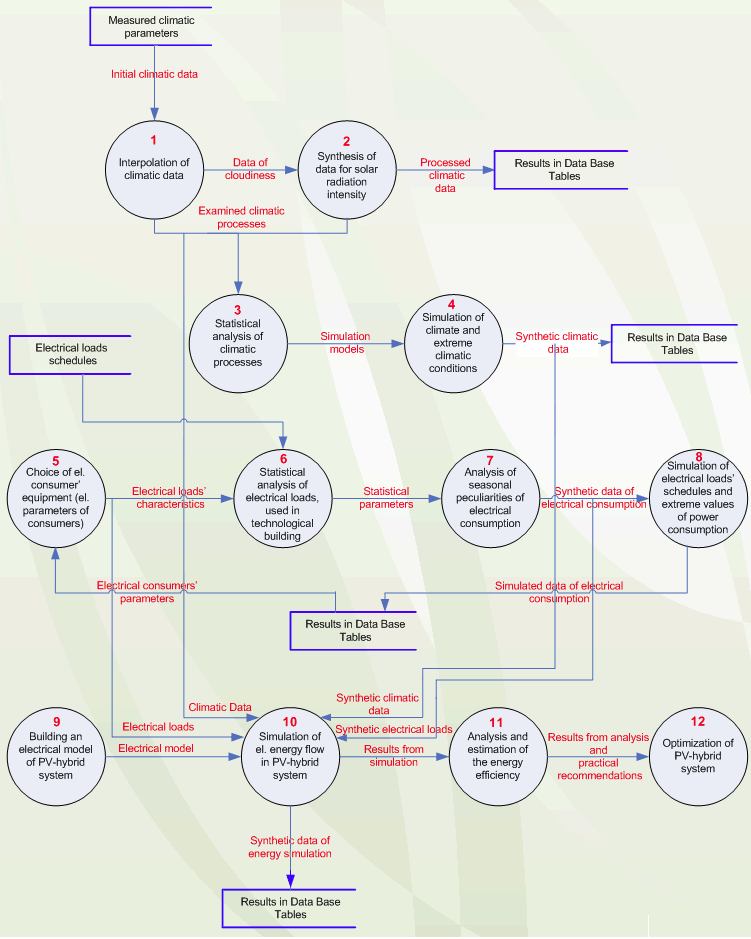
Fig.2. DFD level-0
More comprehensive explanation of each
process is given as follows: 1-Climate data interpolation (cloudiness,
air temperature, wind speed) at a discrete time gap of 1 hour during
the
24-hours periods of selected astronomic year, 2- Hourly simulation of global solar
radiation intensity for a period of one astronomic year, 3- Statistical evaluations (means,
density
of distribution, standard deviation, auto- and cross correlations) and
parameters
of a probability distributions of the meteorological processes, 4-Simulation models of synthetic climate
data generation and synthesis of extreme climate conditions for system
operation, 5-Choosing a type of electrical consumer
equipment–for living, for technological production. The daily
and monthly
electrical loads schedule determination, 6- Analysis of schedules of electric
power
consumption in a technological building (breeding house for broilers)
by
typical months and seasons- transitional (spring, autumn), summer and
winter, 7- Calculating the statistical
evaluations
and parameters of a probability distribution functions of electric
energy
consumption, 8-Building simulation models for
synthetic
generation of electric energy consumption and imitation of extreme
conditions
of power supply, 9-Development of electrical model of
PV-hybrid system for alternative energy production, 10-Synthesis of algorithm for electric
energy flow simulation at the time of system operation, 11- Analyzing and estimating an energy
efficiency of designed PVhybrid installation on the basis of the
software
simulation results, 12- Finding an optimal PV-hybrid system
configuration and electrical performances.
More elaborate Data Flow Diagram is
drawn
up on a next stage of software system analysis (level 1). It represents
the
processes 9 and 10 of DFD level-0 for design and construction of
alternative
energy device functional model and software simulation of electric
energy flow
in details.
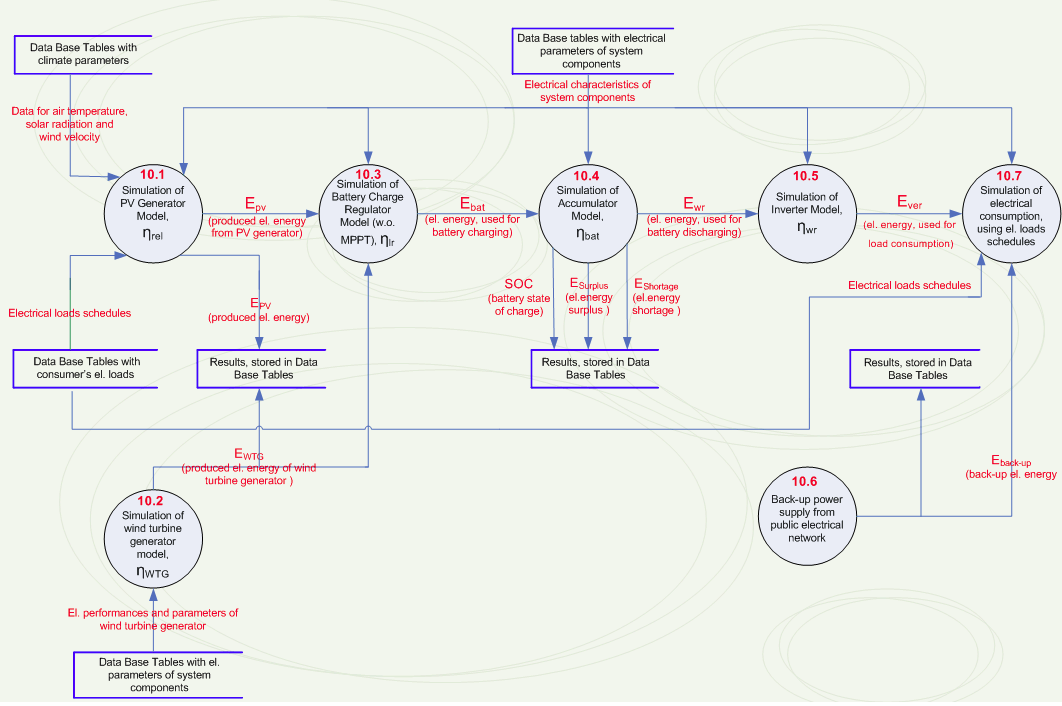
Fig.3. DFD level-1
Position of developed programme RESs
v.1.0 among other
famous software tools of same type available on the market.
Classification
table. The peculiar features and abilities of the developed system and
other
software products are given in the following comparative table (Table
1). It
shows the maincharacteristics and advantages of RESs v.1.0,
that are of great importance for the purposes
and tasks of current research [3].
Table1. Comparative classification of
available
programmes for design, sizing, energy analysis and simulation of
alternative energy devices
for electric power supply.
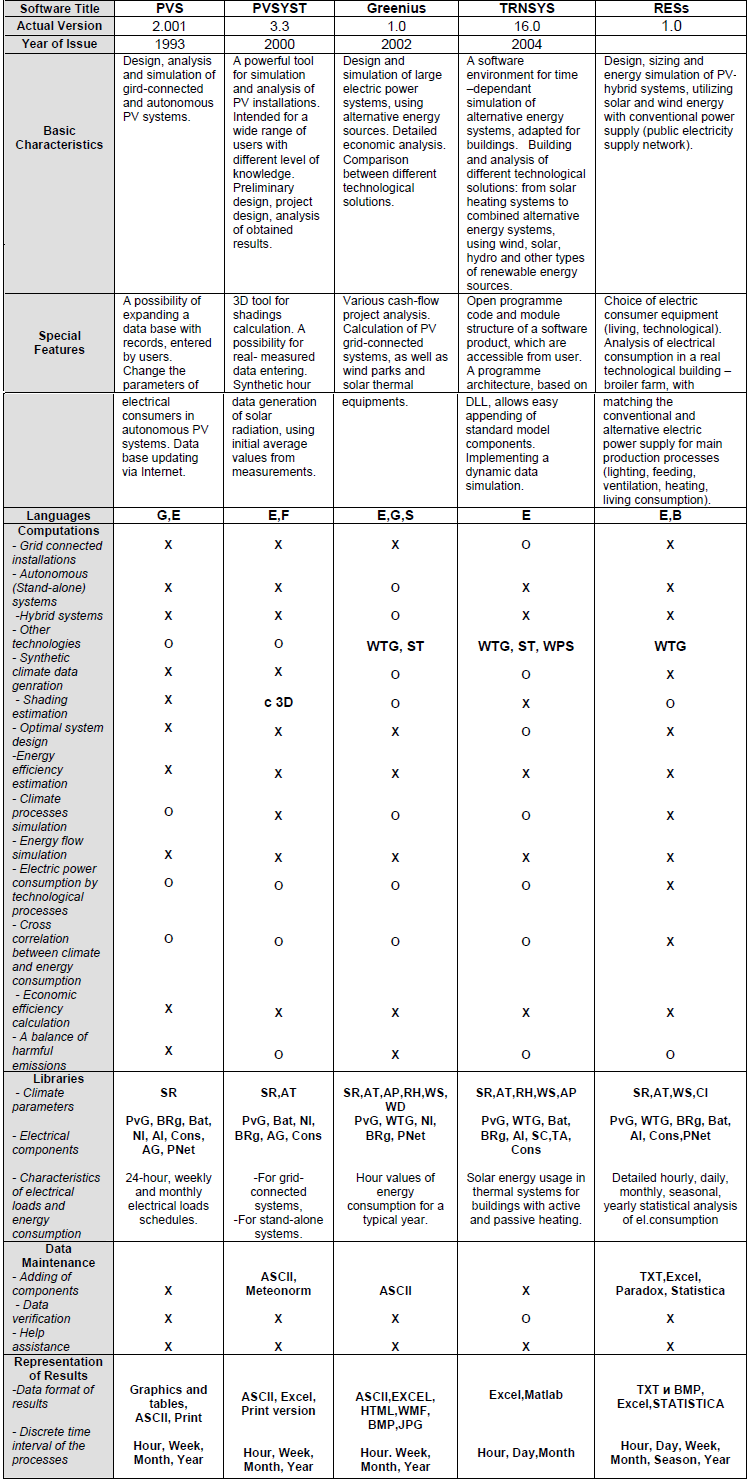
Legend:
X = available, Components
Climate
parameters
O =missing. PvG =
photovoltaic
generator, SR = solar radiation,
WTG = wind turbine
generator, АТ=air
temperature,
Languages BRg= battery load
regulators and
controllers АP =
atmospheric pressure,
E = English, Bat =
battery block, RH
= relative humidity,
B = Bulgarian, I =
invertor (A =
stand-alone, WS = wind speed,
S = Spanish, N =
grid-connected), WD
= wind direction,
G = German, Cons
=electric power
consumption, Cl = cloudiness.
F = French. AG =
auxiliary generator
(diesel),
PNet = public electrical
network,
Other technologies SC = solar collector,
WPS = waterpower energy ТА = thermal accumulator.
system,
WTG = wind energy system,
ST = solar thermal
installation.
A table shows the
specific
advantages of developed software RESs in comparison with other
available
programmes. The main difference with others are: the ability for cross
correlation
estimations of local climate conditions of the geographical region and
electrical loads of selected technological building, that has to be
energetically supplied by designed PV-hybrid system. During PV device
design
and simulation cycles the climate parameters are considered. A product
RESs
offers an optimal configurations by means of a statistical analysis of
long-term meteorological information and schedules of power
consumption. On the
base of real-measured data for a climate and electric consumption, a
programme calculates
the etalons of extreme meteorological parameters and characteristics of
extreme
energy consumption, that are very important for choosing the optimal
PV-hybrid installation
design.
CONCLUSIONS
A paper presents some
basic stages
of structural development of software system RESs. Product could be
used during
design of PV-hybrid and stand-alone systems for power supply of daily
needs and
technological processes in agriculture (breeding farms for broilers).
REFERENCES
[1]
Зарубин, В.С. Математическое моделирование в технике. Москва, Изд. МГТУ им.
Н. Э. Баумана, 2003
[2]
Маринов,
М. Информационни системи. Анализ и проектиране. Русе, Изд.
“Авангард принт”
ООД, 1999.
[3]
http://retscreen.gc.ca/ang/g_model_a.html
ABOUT THE AUTHORS
Katerina Gabrovska,
Master of
Computer Systems, Department of Computing, ‘Angel
Kantchev’ University of
Rousse, e-mail: KGabrovska@ecs.ru.acad.bg
Assoc.Prof. Angel Smrikarov, PhD, Head of Department of Computing,
‘Angel Kantchev’
University of Rousse, e-mail: ASmrikarov@ecs.ru.acad.bg