
Content
- Introduction
- The Objective and main tasks, expected scientific novelty, expected practical results
- A summary of the results of their own
- Conclusion
- References
Introduction
Currently, computer diagnostics systems are widespread and used for the diagnosis of almost all of the human body. Therefore, the actual problem is to increasing the accuracy of diagnosis which leads to the improvement and introduction of new technologies in the diagnostic systems.
Fractures of varying severity were and are quite frequent. Often, for restoration fracture should produce surgery. In addition, each surgery must be planned in advance. Fragments of bone fractures are often displaced. For the treatment of fractures is expected to produce fragments reposition. There is comparison of bone fragments after a fracture and strong fixation.
We must choose which side to mount the latches to ensure complete immobilization of bone fragments. To do this, it is important to consider the direction and thrust force of the muscles that attach to the fragments.
Thus, there is a need to develop a decision support system in the planning of operations for fractures, which would ensure finding the direction of displacement of the fragments of bone.
The Objective and main tasks
Objective: To increase the effectiveness of trauma preoperative planning through the using of decision support system that provides options for selecting fixation fragments in extremities fractures.
The main tasks:
- To analyze the process of operation limbs fractures.
- To develop modification algorithms the computer analysis of X-ray images.
- To develop the structure of decision support systems.
- To approbate designed modifications and to test the algorithms.
Expected scientific novelty
- Development of modified method for evaluation of contour X-ray image segmentation quality.
- Development of new decision support system structure for managing the process of planning the operations for fractures of the extremities.
Expected practical results
- The developed modification algorithms will allow to determine the direction of displacement of bone fragments in extremities fractures.
- The developed software will manage the operations planning for extremities fractures.
A summary of the results of their own
We must for automation process of pre-planning do next:
- acquainted with the anatomy of the limbs and to pay attention to the attachment of muscles and how they work;
- when analyzing X-ray images of extremities fractures we need to identify: the number of fragments, their size, their location relative to each other, and the place of localization.
The most difficult and dangerous extremity bone fractures are fractures of the hip. There are fractures:
- the upper end of the femur;
- the middle part (diaphysis (body of the bone));
- the lower end of the femur, which include fractures of the femoral condyles [1].
We are interested in is the body of the bone.
For ease determine the localization of the fragments, arbitrarily divide the femoral diaphysis into thirds and define which muscles are attached to these sites.
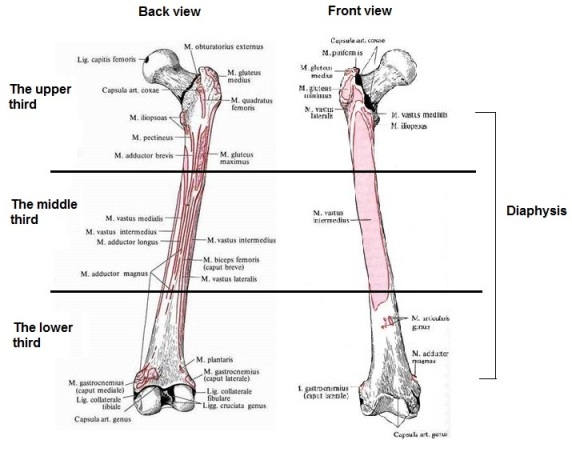
Figure 1 – The site of attachment of the thigh muscles
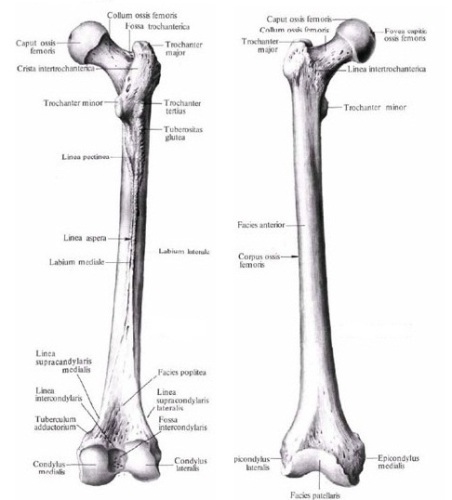
Figure 2 – The anatomical structures of the femur
The direction of traction is carried out in the next major areas:
Forward (toward the observer, perpendicular to the frontal plane)
Back (from the observer, perpendicular to the frontal plane)
Down ↓
Inside ←
Outside →
The information about muscles is presented in Table 1 [2, 8].
Table 1. The direction of traction of the femur
| Muscles | The direction of traction | The sites of the attachment | |
|---|---|---|---|
| The upper third | m. vastus medialis | forward | linea aspera, lig. patellae |
| m. vastus intermedius | forward | fasies anterior | |
| m. pectineus | inside, forward | os coxae (pelvic bones), linea aspera | |
| m. adductor brevis | inside, forward | os coxae (pelvic bones), linea aspera | |
| m. gluteus medius | outside | os coxae (pelvic bones), trochanter major | |
| m. quadratus femoris | outside | os coxae (pelvic bones), trochanter major | |
| m. iliopsoas | forward, outside | os coxae (pelvic bones), trochanter minor | |
| m. obturatorius externus | outside | os coxae (pelvic bones), fossa trochanterica | |
| The middle third | m. vastus medialis | down | linea aspera, lig. patellae |
| m. vastus intermedius | down | fasies anterior | |
| m. adductor longus | inside | os coxae (pelvic bones), the middle third of linea aspera | |
| m. vastus lateralis | forward | trochanter major, m. rectus femoris (tendo) | |
| m. adductor magnus | inside, forward | os coxae (pelvic bones), linea aspera and condylus medialis | |
| m. biceps femoris | down | os coxae (pelvic bones) and the lower part of linea aspera, capitis fibulae | |
| The lower third | m. adductor magnus | inside, forward | os coxae (pelvic bones), linea aspera and condylus medialis |
| m. vastus lateralis | forward | trochanter major, m. rectus femoris (tendo) | |
| m. vastus intermedius | forward | fasies anterior |
In studying the mechanism work muscles, their thrust, it can be concluded about where to move a fragment of bone fracture.
As noted above, it is necessary to create a decision support system that will determine the bone fragments displacement direction. To do this, follow these steps:
- to identify the objects contours;
- to determine the objects number;
- to determine the location of each fragment;
- to find a set of muscles that are attached to the fragments;
- to determine each fragment the displacement direction.

Figure 3 – Stages of image processing
(animation: 4 – number of frames, 7 – number of cycles repeat, 83.4 KB)
The first step is to distinguish the contours of objects. We need to choose the method that will give the most accurate contour. We plan to use the following methods: Kirsch, Canny, Sobel, Prewitt and Roberts [3–6].
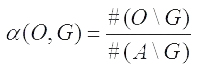
The original images are digitized radiographs in jpeg format in Grayscale [0…255] (Fig. 4,a). We represent them as a set of Ai, i∈{1, …, N}. For each Ai on the basis of specialist trauma expert assessment formed a binary image Gi (GT-image).
We must define a processing image method F, which transforms the original image Ai in binary images. In this case, the difference between the image Oi, formed by F, and Gi, experts, should be minimal:
Δ – the measure of the differences between two images.
The most common method of evaluating the contour segmentation is visual. However, this method does not allow automated selection of the most accurate method.
Analysis of the source [7] allows us to identify the main types of the selection border quality characteristics:
1. The share selected the correct T boundary pixels in the image (T→max);
2. The degree of localization L, which determines the selected pixels proximity to the corresponding image on the GT-image (L→max).
Assume # A for the cardinality of the set A and define a set of investigated measures assessing the quality of the borders:
1. Error of the first kind – the ratio of incorrectly selected boundary pixels to the total number of pixels that are not boundary.
2. Error of the second kind is defined as the ratio of unallocated boundary pixels to the total number of boundary pixels.

3. Specificity – the ratio of not selected boundary pixels to the total number of not boundary pixels of GT-image:
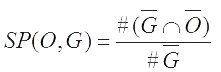
4. Sensitivity – the ratio of correctly selected boundary pixels to the total number of boundary pixels GT-image:

α and β are the errors, that is, their value should seek to minimize. Since SP and SV are the quantitative characteristics of the correctness of the construction of the circuit, their values should strive to maximum. Results of the quality assessment circuit in the application of various methods of radiographic images contour segmentation are summarized in Table 2.
Table 2. Analysis of the quality of the X-ray image contour segmentation.
| Method \ Measure | α | β | SP | SV |
|---|---|---|---|---|
| Kirsch | 0,9363 | 0 | 1 | 0,0673 |
| Canny | 0,0543 | 0,3974 | 0,6026 | 0,9460 |
| Sobel | 0,0523 | 0,4155 | 0,5845 | 0,9479 |
| Prewitt | 0,0490 | 0,4204 | 0,5796 | 0,9512 |
| Roberts | 0,0677 | 0,3952 | 0,6048 | 0,9326 |
Results of contour segmentation are presented in Figures 4, b-f.
 original image")
 Canny")
 Kirsh")
 Prewitt")
 Roberts")
 Sobel")
Figure 4 – Example of contour segmentation of radiographic images: a) original image; b) Canny; c) Kirsh; d) Prewitt; e) Roberts; f) Sobel.
The amounts of α and SV, as well as β and SP are equal to 1. Consequently, α и β values results in evaluating the contour segmentation can be discarded.
To verify the results of the evaluation of contour segmentation (Fig. 4) conduct an additional visual analysis. Here we consider the number of discontinuities of contours, additional noise, the accuracy of contour lines in comparison with the ideal path. Evaluation results are expressed by the coefficient k∈[0;1] and are shown in Table 3.
Table 3. Comparison of the X-ray image contour segmentation.
| Evaluation \ Method | Kirsh | Canny | Sobel | Prewitt | Roberts |
|---|---|---|---|---|---|
| k | 0 | 1 | 0,6 | 0,5 | 0,7 |
| γ | 0,5334 | 0,7743 | 0,7662 | 0,7654 | 0,7687 |
For consistency between the results of visual evaluation and the values of SV and SP, listed in Table 1, it is proposed to use the arithmetic average of these estimates.
This is due to the fact that with the maximum values of these measures the result of processing is the best. The greatest value of γ in the Canny method happened, it is possible to conclude that this method is best suited for edge detection on radiographs.
Conclusion
Process of preoperative planning was studied, the anatomical features of the structure of the femur were examined and steps to solve this problem were designed. Optimal methods for image segmentation contour radiographs were chosen.
Note! The master’s work is not finished after writing this author’s abstract. The completion is in the December 2012. The full text of the work and the materials on the topic can be taken from the author or her instructor after the given date.
References
- Информация о продукте MediCAD [Электронный ресурс]. – Режим доступа: http://hectec.de.
- Информация об Agfa HealthCare [Электронный ресурс]. – Режим доступа: http://ehealthnews.eu.
- Информация об Orthocrat, Ltd. [Электронный ресурс]. – Режим доступа: http://bioportfolio.com.
- Анализ рентгенограмм и протоколирование рентгенологических исследований [Электронный ресурс]. – Режим доступа: http://zhuravlev.info.
- Травматические повреждения бедра [Электронный ресурс]. – Режим доступа: http://traumatology.eurodoctor.ru.
- Большая медицинская энциклопедия. Мышцы бедра [Электронный ресурс]. – Режим доступа: http://spravochnik-anatomia.ru.
- Грищенко А.А. Обработка изображений, цифровая обработка сигналов, распознавание образов [Электронный ресурс]. – Режим доступа: http://sati.archaeology.nsc.ru.
- Детектор границ Канни [Электронный ресурс]. – Режим доступа: http://habrahabr.ru.
- Градиентные методы подчеркивания контуров [Электронный ресурс]. – Режим доступа: http://sernam.ru.
- Гонсалес Р. Цифровая обработка изображений в среде MATLAB / Гонсалес Р., Вудс Р., Эддинс С. – М.:Техносфера, 2006. – 616с.
- Грибков И.В. Некоторые вопросы количественной оценки производительности детекторов границ / Грибков И.В., Захаров А.В., Кольцов П.П. и др. // «Программные продукты и системы» №4, 2011.
- Анатомия бедра [Электронный ресурс]. – Режим доступа: http://sportmedicine.ru.