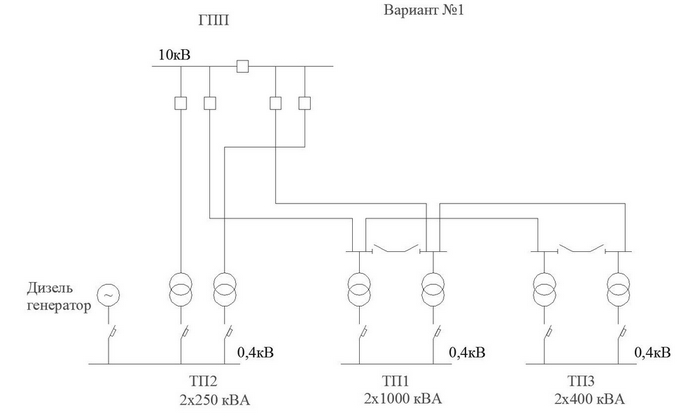
Picture 1 – Power supply scheme (without DU) for first variant.
УДК 658.26:621.31
ECONOMIC JUSTIFICATION OF CHOICE OF POWER SUPPLY SCHEME FOR ADMINISTRATION AND TRADE COMPLEX
Buynov S.I., student; Bershadskiy I.А., associate professor, Candidate of Science
(Donetsk National Technical University, Donetsk city, Ukraine)
In this article there is considered economic choice of power supply scheme for administration and trade complex (1 variant – scheme with distribution unit (DU), 2 – without DU), which consists of: head office of telephone company OJSC «Ukrtelekom» - ТП2 (design power amounts Sр=265,06kW, I and II category of power supply, power factor cosφ=0,92), administrative and trade center «Kontinent» - ТП1 (Sр=1129,77 kW, I and II category of power supply, cosφ=0,91), shop «Eldorado» - ТП3 (Sр=366,16 kW, I, II category of power supply, cosφ=0,93).
.
Picture 1 – Power supply scheme (without DU) for first variant.
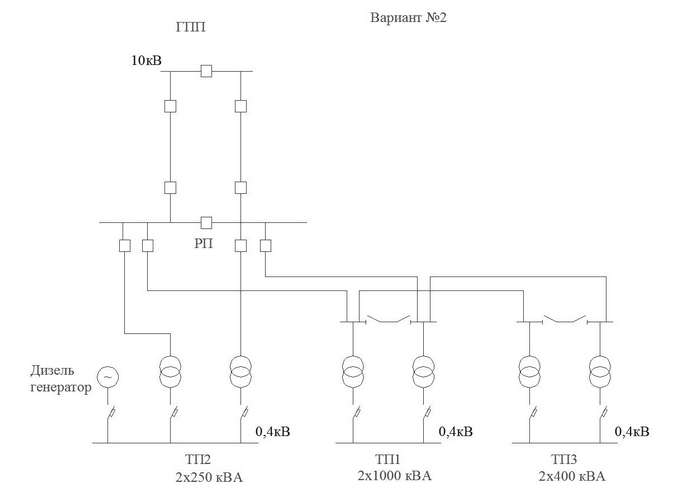
Picture 2 – Power supply scheme (with DU) for second variant.
From catalogue I choose cost of equipment and put it into Table1 and Table 2.
Table 1- Cost of equipment (variant 1, without DU).
|
Camera № |
Name |
Quantity |
Price, UAH |
Total |
|
8 |
Incoming cubicle |
6 |
55 930 |
335 580 |
|
9 |
Transformer bay |
6 |
13 925 |
83 550 |
|
6 |
Section switch bay |
4 |
48 600 |
194 400 |
|
24 |
Tie breaker bay |
4 |
10 850 |
43 400 |
|
Transformer |
|
|
|
|
|
( oil-filled waterproof transformer) 400/6 - 10/0.4 |
2 |
46 750 |
93 500 |
|
|
( oil-filled waterproof transformer) 250/6 - 10/0.4 |
2 |
36 750 |
73 500 |
|
|
( oil-filled waterproof transformer) 1000/6 - 10/0.4 |
2 |
116 250 |
232 500 |
|
|
|
|
total |
1 056 430 |
|
|
cable |
|
|
|
|
|
АПвЭП-10 3х120 |
7480 |
520 |
972 400 |
|
|
|
|
total |
2 028 830 |
|
Table 2- Cost of equipment (variant 2, with DU).
|
Camera № |
Name |
Quantity |
Price, UAH |
Total |
|
8 |
Incoming cubicle |
6 |
55 930 |
335 580 |
|
9 |
Transformer bay |
6 |
13 925 |
83 580 |
|
6 |
Section switch bay |
4 |
48 600 |
194 400 |
|
24 |
Tie breaker bay |
4 |
10 850 |
43 400 |
|
13 |
Voltage transformer bay |
2 |
23 630 |
47 260 |
|
1 |
Outgoing line bay to DU |
2 |
46 250 |
92 500 |
|
Transformer |
|
|
|
|
|
(oil-filled waterproof transformer) 400/6 - 10/0.4 |
2 |
46 750 |
93 500 |
|
|
(oil-filled waterproof transformer) 250/6 - 10/0.4 |
2 |
36 750 |
73 500 |
|
|
(oil-filled waterproof transformer) 1000/6 - 10/0.4 |
2 |
116 250 |
232 500 |
|
|
|
|
total |
1 196 220 |
|
|
Cable |
|
|
|
|
|
АПвЭП-10 3х120 |
3974 |
130 |
516 620 |
|
|
|
|
total |
1 712 840 |
|
Hereinafter I bring formulae for
calculation, and calculation itself for first and second variant is
brought to Table 3 and Table 4.
1. Investment calculation
1.1 Investment to cable lines.
Cable is laid into trench taking into consideration crossing over road surface.
Category of soil – II (Light loam, loess soil, gravel, sand with crushed stones, clay sand with construction waste).
Variant 1:
Length
of cable from ГПП to ТП2
2х1768m. From ГПП
to ТП1 2х1807m.
From ТП1 to ТП3
2х165m. Total 7480m. Length of cable line
(CL) composed of four cables amounts
![]() =1739m. Length of KL composed of two cables amounts
=1739m. Length of KL composed of two cables amounts
![]() =262m.
=262m.
Variant 2:
Length
of cable from ГПП to РП
2х1768m. From РП
to ТП1 2х54m.
From ТП1 to ТП3
2х165m. Total 3974m. Length of KL composed
of two cables amounts
![]() =1987м.
=1987м.
For calculation we use consolidated cost indices [1].
![]()
where:
![]() -
consolidated cost indices of cable laying with account of materials;
-
consolidated cost indices of cable laying with account of materials;
![]() -
consolidated cost indices of construction part by laying of two
cables;
-
consolidated cost indices of construction part by laying of two
cables; ![]() -
consolidated cost indices of construction part by laying of four
cables;
-
consolidated cost indices of construction part by laying of four
cables;
1.2 Investment to electric substations.
![]()
where:
![]() -
cost of installed equipment on three electric substations;
-
cost of installed equipment on three electric substations;
![]() -
consolidated cost indices of construction part of closed distribution
devices building 6-10 kW exclusively of cost of electric equipment
[1].
-
consolidated cost indices of construction part of closed distribution
devices building 6-10 kW exclusively of cost of electric equipment
[1].
1.3 Total investments.
![]()
2 Calculation of annual fixed charges
2.1 Annual fixed charges on CL.
Fixed charges for service and amortization charges for overhaul:
![]() ,
,
where:
![]() -
amortization charges for overhaul in % from capital expenditures,
-
amortization charges for overhaul in % from capital expenditures,![]() ;
;
![]() -
charges for service in % of capital expenditures,
-
charges for service in % of capital expenditures,
![]() [1].
[1].
Amortization charges for renovation:
![]() ,
,
where:
![]() -
amortization charges for renovation in % of capital expenditures,
-
amortization charges for renovation in % of capital expenditures,
![]() .
.
2.2 Annual fixed charges on electric substations.
Fixed charges for service and amortization charges for overhaul:
![]() ,
,
where:
![]() -
amortization charges for overhaul in % of capital expenditures,
-
amortization charges for overhaul in % of capital expenditures,
![]() ;
;
![]() -
charges for service in % of capital expenditures,
-
charges for service in % of capital expenditures,
![]() [1].
[1].
Amortization charges for renovation:
![]() ,
,
where:
![]() -
amortization charges for renovation in % of capital expenditures,
-
amortization charges for renovation in % of capital expenditures,
![]() .
.
2.3 Total fixed charges for service and amortization charges for overhaul.
![]()
2.4 Total amortization charges for renovation
![]()
3. Annual fixed charges for compensation of annual electric power losses
3.1 Electric power losses in power lines.
We calculate electric power losses in line under using time of power losses:
![]() ,
,
where: S – maximum capacity transmitted per electric network;
U – mains voltage; Rл – active resistance of line.
For typical load diagrams using time of power losses is:
![]() ,
,
where: Т – time of maximum load usage.
Active resistance of cable:
![]() ,
where:
,
where:
![]() – specific active resistance of cable.
– specific active resistance of cable.
Total electric power losses in lines:
![]()
Variant 1:
Т =5400h. Line 1 from ГПП to ТП2 l =2х1768m. S=265,06 kVA.
Line 2 from ГПП to ТП1 l =2х1807m. S=1637,39 kVA.
Line 3 from ТП1 to ТП3 l=2х165m. S=366,16 kVA.
![]() kW∙h.
kW∙h.
Variant 2:
Т =5400h. Line 1 from ГПП to РП l =2х1768m. S=1902,45 kVA.
Line 2 from РП to ТП1 l =2х54m. S=1637,39 kVA.
Line 3 from ТП1 to ТП3 l=2х165m. S=366,16 kVA.
![]() kW∙h.
kW∙h.
3.2 Electric power losses in transformers.
 ,
,
where:
![]() -
no-load losses, kW;
-
no-load losses, kW;
![]() -
short-circuit losses, kW;
-
short-circuit losses, kW;
![]() -
maximum electric load, MVA;
-
maximum electric load, MVA;![]() -
transformer capacity, MVA;
-
transformer capacity, MVA;
n
– quantity of transformers.
![]() h.
h.
Total electric power losses in transformers:
![]() .
.
ТП1-
two oil-filled waterproof transformers:
![]() =1000
kVA,
=1000
kVA,
![]() =1271,23
kVA;
=1271,23
kVA;
ТП2- two oil-filled waterproof
transformers:
![]() =250
kVA,
=250
kVA,
![]() =265,06
kVA;
=265,06
kVA;
ТП3- two oil-filled waterproof
transformers:
![]() =400
kVA,
=400
kVA,
![]() =366,16
kVA.
=366,16
kVA.
![]() kW∙h/year.
kW∙h/year.
3.3 Electric power losses per variants.
![]() ,
,
![]() kW∙h/year;
kW∙h/year;
![]() kW∙h/year.
kW∙h/year.
3.4 Cost of annual electric power losses.
![]() ,
,
where:
![]() =1
UAH/kW·h – average tariff per electric energy for 2nd
class.
=1
UAH/kW·h – average tariff per electric energy for 2nd
class.
Table 3 - Basic technical-economic indices of compared variants.
|
Indices |
Variant I |
Variant II |
|
Investments, thous. UAH. |
12 035.96 |
11 197.3 |
|
Total fixed charges on equipment service and amortization charges for overhaul, thous. UAH / year |
592.9 |
578.1 |
|
Total amortization charges for renovation, thous. UAH/year |
1 577.8 |
1 527.45 |
|
Cost of annual electric power losses, thous. UAH / year |
122 569.5 |
130 232 |
Table 4 – Estimation of economical efficiency of the variant of external power supply of enterprise.
|
Index |
Value |
|
Quantity of
saved electric energy
|
7662,5 |
|
Cost of saved
electric energy,
|
7.663 |
|
Difference
in charges for service and amortization for overhaul
|
14.8 |
|
Balance
sheet profit |
-7.137 |
Conclusion: considered variants in this case are distinguished by length of used cable, electric energy losses and quantity of used bays of single-end service assembled chamber. Cable section, quantity and transformer power are the same. There are less electric energy losses in more expensive variant I (and in some cases it may have advantage during operation). But in this very calculation balance sheet profit is negative, that`s why we choose more cheaper variant II. Because for the term of payback of electric equipment variants (4 years), variant I does not compensate at the expense of less electric power losses cost of variant II.
List of literature:
1. Экономическое обоснование технических решений в дипломных проектах по электроснабжению предприятий АПК/ Н.Г. Королевич, В.В. Ширшова, Г.И. Янукович. – Минск: БГАТУ, 2008. – 78с.
2. Федоров А.А., Каменева В.В. Основы электроснабжения промышленных предприятий: Учебник для вузов.– 3-е изд., перераб. и доп. – М.: Энергия, 1979. – 408 с., ил.
3. Правила устройства электроустановок. – Х.: Изд-во «Форт», 2009. – 704 с.