
AbstractContents
IntroductionResistance welding is widely used in the industry, and
its share continues to grow. Mode of resistance welding machines (RWM)
is characterized by a small value of the coefficient In addition, to select the protection and verification of the network elements to the dynamic resistance to know the peak currents occurring in the network while turned a RWM. To accurately determine the peak current and the voltage
drops to the required boundary for this probability The aim is to reduce the cost of reasonable network supplying the RWM group with a guaranteed level of voltage that will be achieved by improving the accuracy of the calculation of peak current and voltage losses. 1. The interim guidance in 1974 on the calculation of peak current and voltage drops in the power networks of resistance welding machinesThe initial data [1, 2] used graphics processing load of welding machines or power they consume and the coefficients of inclusion. If these data are not accepted as a source of welding machines passport data and calculated the average load factors and the inclusion obtained with surveys of existing installations. It is also necessary to know the layout of the shop, a list of semi-detached welding machines and their operation. 2. Calculation of peak current and voltage losses in accordance with the GuidelinesThe method [6, 7] can be applied to any electrical loads which are characterized by high frequency and a low duty cycle. The input data for the calculation are: the layout of the designed plant, passport data of welding machines, a list of semi-detached welding machines, welding machines operation. If there is no settlement process data or schedules of machines for welding cycle load calculation is performed using the average load factors and on. Used in the calculation of the average load factors and include the definitions of the survey welding systems a significant number of existing production. The power factor of welding machines based on the results of experimental studies engineering enterprises is assumed to be 0.6. 2.1. Determination and designation of the basic quantitiesSingle-phase welding machines are considered included in the line voltage. Considered two-phase machines having two arms that are connected to the three phases to an open triangle involving the same time. Considered three-phase machine with three arms that are connected to the three phases of the network, and include the same time. Two-phase and three-phase machines with multi-temporal inclusion shoulders are considered as a group of single-phase machines.
When using the average statistical load factors and the
inclusion of the average consumed
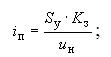
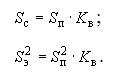
When used as an input welding transformers installed capacity and the average load factors and the inclusion of individual peak currents machines are defined as follows, A: for single-phase machines
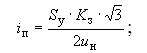
for two-phase machines included on the open delta: for a total phase
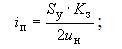
for the remaining phases
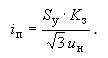
for three-phase machines
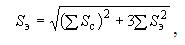
2.2. The procedure for calculatingThe calculation is performed in two stages. At the first stage of the calculation all welding machines are considered single-phase and evenly distributed over the phases. For each welding machine and determined the average square of the effective power: Further defined the approximate calculation welding load:
by which the pre-selected craft transformers and mains supply of 380 V. Then all welding machines to be distributed in phases so as to ensure uniform loading of all phases of the power supply. The uneven loading phase should not exceed 15%. The next step is to determine the average effective and peak loads of the single-most loaded phase. Average current supply line is obtained as the arithmetic sum of the mean currents of all machines connected to this phase, A:
where For multi-point welding machine load average, A:
where Effective load of welding machines
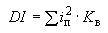
where Because of the low values of the coefficient for the inclusion of the individual peaks load machines can be assumed that the variance of a single current peak is almost equal to the square of the effective value of the welding cycle. For this reason, the total dispersion of the line current with sufficient accuracy can be taken as the sum of squares of effective currents of individual machines. For a group of welding machines
At
Peak load of welding machines
where 3. Other methods of calculating the peak current and voltage drops in the power of resistance welding machinesMethods for calculating underlying operating Guidelines [1] and the previous edition [2, 3], as shown by the results for examples with a small amount of welding machines (up to 16) to overestimate the calculated peak current and voltage losses. The method of "Distribution functions of the border" [4] provides only the borders of the actual values of voltage loss and peak currents, so the design of the electricity grid can not take advantage of them to the RWM. Checking the "Random selection" [4] shows that when he repeated his application gives considerable variation of the distribution functions and the calculated values of the unknown quantities, and the method of "Multiple random selection" [4] in their calculation algorithm contains several (about 10) of the distribution functions and subsequent averaging, leading to a corresponding increase in the volume and duration of the calculation. In the methods of the "Distribution functions of the border", "Random selection" and "Multiple random selection"to reduce the volume of calculations used welding machines division into 7 groups according to the number of phases of welding machines and from that to which they are connected phases. As a result, one group may be machine, power that is much different machines and for the same capacity due to different distances from the power source will be different voltage drops created by these machines. In addition, if present in the group, for example, only one phase machines, the machines will be distributed to all three groups. This inevitably affects the accuracy of the calculation. To eliminate these drawbacks in the "Integrated differential" method, the distribution function of the peak current of each phase and the loss of each line voltage is calculated separately. The first stage of this common calculation is to determine the current and line voltage drops that occur when you connect each machine individually. The calculation is carried out in an integrated form by Ohm's and Kirchhoff's laws. To determine the distribution function of peak phase current all machines fall into 7 groups: one group determined machines are not connected to this phase, the machine further divided into two groups depending on the phase of the peak current. The resulting group subsequently divided into groups depending on the magnitude of the peak current of the module. This process is as long as the total number of groups, which are separated welding machine not to be equal to 7 or in each of the peak currents are the same machines. Thus, as a result of such a division into groups of machines in one group are machines whose influence on the desired value are not significantly different and the current from each of the vehicles can be replaced by an average current in the group of machines. A similar distribution is performed by groups of machines in the calculation of the distribution function of voltage drops. The distribution functions are calculated by examining
all the possible combinations of simultaneous inclusion of different
numbers of groups of machines. It is assumed that the coefficients of
the inclusion of all welding machines are the same and equal to the
average 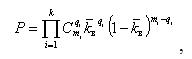
where i – number of the group; k – the number of groups; mi – number of cars assigned to the i-th group; qi –the number of vehicles included in the i-th group. Peak current for the given combination of the included welding machines is calculated as the geometric sum of the currents included welding machines (current welding machine is taken as the average current machines in its group). In the construction of the distribution function of the total current module is used. The distribution function of voltage loss is obtained by a similar algorithm except that for each combination of machines at the same time included the total voltage drop is calculated by summing the geometric voltage drops created by each of the included RWM. The voltage at the end of the busbar voltage equal to the difference on the power supply and the voltage drop in the network. Loss of voltage is needed for the construction of the distribution function is calculated as the difference in voltage at the beginning of the modules at the end of the busbar. The obtained values of inclusion probabilities of
welding machines, peak current and voltage losses in these modes, and
are the initial data for the construction of portions of the respective
distribution functions until they reach significance The final stage of the calculation is the determination of the maximum calculated value of the corresponding value, which is the abscissa of the point of intersection of the distribution function of the probability 1 – ex. To find the maximum design value of all the necessary current and voltage losses, this approach is performed six times. To assess the accuracy of the developed method using the theoretical distribution function of peak current and voltage drops obtained by searching all possible combinations of the simultaneous operation of welding machines using the algorithm accurately calculate the voltage and current of all branches of the chain with an arbitrary set of welding machines [5]. For a group of 16 ISS capacity from 16 to 495 kVA, working with a coefficient of 0.05 with the inclusion of their nutrition from the straight trunking type SMA-4 with a rated current of 1250 A is connected to the transformer type TMZ-1000/10. Figures 4 and 5 show the theoretical distribution function (curve 1) the peak current of one phase and a line voltage loss, the calculated values of (points 3 and 4) and the distribution function of the values obtained by the method according to the "Integrated differential" method (curves 2). This figure also shows the calculated value of the corresponding peak current and voltage loss, calculated in accordance with the applicable guidelines (point 5) and their previous version (point 6). This example and the others (of Example 24 was examined in which the accuracy of these methods was assessed relative to solutions obtained by the theoretical distribution function) indicates a high accuracy "Integrated differential" method, since it is not an error has exceeded 10%, while the error existing Guidelines exceeded this value. Oversize applicable Directives of the results of calculation of loss-voltage leads to the need to increase the capacity of the transformer and busbar section as to ensure the quality of welded joints voltage drop should not exceed 10%. Thus, application of the method developed "Integrated differential" method will reasonably reduce costs electricity network ISS, providing the required level of voltage therein. 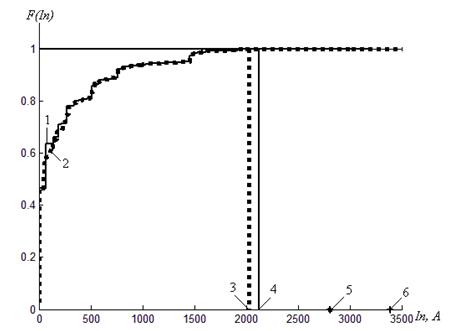
Figure 4 – The distribution functions of the peak current of one phase 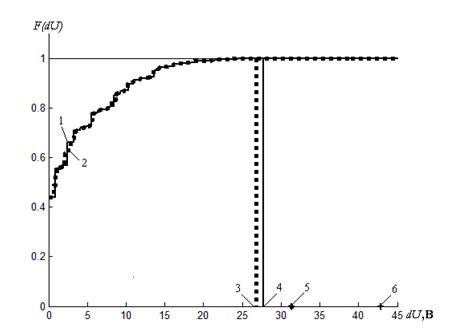
Figure 5 – Distribution function of the loss of one line voltage ConclusionA common drawback of all the above listed methods of calculating the peak current and voltage drops in the power networks of resistance welding machines is that the calculation of the distribution functions is used instead of the average coefficient of inclusion factors include each welding machine. This results, as shown by the results of calculations to increase up to 40% accuracy. Therefore, in the future we plan to improve the "Complex differential method," which will be taken into account in the calculation of the coefficients of each welding machine. References
|
 – installed capacity of welding machine transformer at rated
nameplate duty cycle is specified in the data sheet vehicles; kV
• A;
– installed capacity of welding machine transformer at rated
nameplate duty cycle is specified in the data sheet vehicles; kV
• A; – the load factor of the machine, which expresses the ratio
of the peak power consumption to the set;
– the load factor of the machine, which expresses the ratio
of the peak power consumption to the set; – factor of inclusion, reflecting the length of the machine
is turned in a complete cycle of welding.
– factor of inclusion, reflecting the length of the machine
is turned in a complete cycle of welding. , efficient
  and peak
  power are determined by the following formulas,
kV• A:
power are determined by the following formulas,
kV• A:

 – the average load of a single welding machine.
 – the average load of the stage each peak load diagram for
one cycle of welding.
– the average load of the stage each peak load diagram for
one cycle of welding.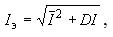
 – the dispersion phase load,
  .
.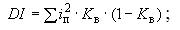

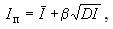
 – the probability factor.