
Abstract
Content
- Introduction
- Background
- The purpose of the study
- The subject and the object of study
- Research Methods
- 1. Theoretical aspects of the formation of the competitiveness of the regional economic system
- 2. Development of system dynamics model of management of competitive dynamics of regional economic systems
- 3. Analysis of results and development of recommendations to improve the competitiveness of the region
- Conclusions
- References
Introduction
Competitiveness of the region – the ability to provide for the region's economy and successfully adapt to internal and external challenges by creating new economic opportunities through sustainable competitive advantages of the region, to define its role and place in the economic environment of the country and on the world market for goods and services, that is, the ability to region outperform other regions of the individual socio-economic indicators.
Background
Competitiveness most fully reveals a need for further development of the regions as full subjects of the market economy, suggests their economic development and identifies future prospects, forms strategic priorities. The least researched aspect of competitiveness in domestic science is regional.
The purpose of the study
The purpose of master's work is the study of the development of regional economies, the design of system dynamics model of the competitive dynamics of the control regions and practical recommendations to improve the region's competitiveness.
The subject and the object of study
The subject of the study – the model and methods of management of competitiveness of regional economies.
The object of the study are the regional economic system and the analysis of the competitiveness of regions.
Research Methods
In the course of the study were used a general methods of science, and special methods of research: scientific methods and empirical methods, namely: analysis and synthesis, tabular and graphical, mathematical and statistical methods, and methods of system dynamics simulation.
1. Theoretical aspects of the formation of the competitiveness of the regional economic system
In recent years, economic theory and practice have made significant progress in the study of the issues of competition and competitive advantages, the application of the conclusions of the theory in practice.
Competition regions – is a multidimensional concept, which takes into account the competition between the regions of the same country, to compete with other regions of the state, macro-regions – associations of several countries [5].
An important methodological differences between mechanisms of regional development, which are used in Ukraine is the dominant focus of managerial influence on the internal and external factors.
It should be noted that the economic-mathematical methods and models have their research direction of the economy (socio-economic systems), their own subject above all, the quantitative and logical relationships and patterns of current functioning and development of socio-economic systems [6].
2. Разработка системно-динамической модели управления конкурентной динамикой региональных экономических систем
Industrial, social, labor, natural, monetary resources, and infrastructure not only interrelated, but also provide the interconnection of all sub-regional economic system is the basis of its development [9].
In this paper, we use the software PowerSim for design a system-dynamic model of regional competitiveness.
When building a system dynamics model uses the normalized components of the indicators of development and competitiveness of the region.
Consider what it consists of and how each indicator is calculated in the model:
- Gross regional product is modeled using a time trend:
- The indicator of industrial production are also simulated using a time trend:
- The indicator of agricultural production:
- Indicator of economic development of the region is calculated using the formula:
- The employment rate of the population in the region:
- Indicator of demographic reproduction:
- The ratio of wages to the minimum subsistence level:
- Income of the population of the region:
- Expenses of the population of the region:
- The share of wages in the structure of personal income:
- The indicator of the socio-economic sphere of the region:
- Doctor of Science:
- Candidates of Sciences:
- Number of employees scientific organizations:
- The number of scientists:
- The number of organizations that carry out scientific and technical work:
- The volume of scientific and technical work:
- Expenditure on scientific and technical work:
- The indicator of the scientific scope of the region:
- Emissions of air pollutants:
- Reset of wastewater into surface waters:
- Hazardous waste generation I-III hazard categories:
- Indicator of ecological development of the region:
- Integral indicator of development of the region:
The scheme of model of competitive dynamics of the region in the PowerSim, presented in Figure 1:
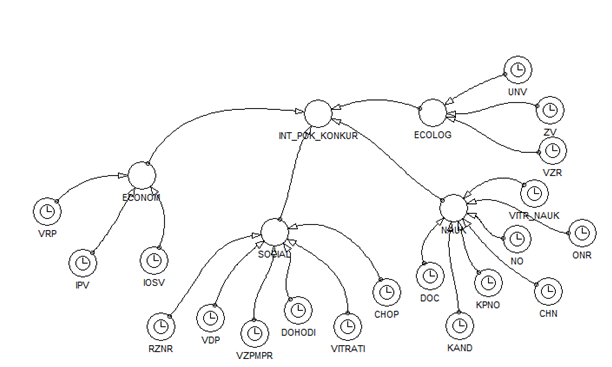
Figure 1. Model of competitive dynamics of the region.
3. Analysis of results and development of recommendations to improve the competitiveness of the region
Let us analyze the results of the simulation and prediction of the competitive dynamics of the region with using the software package Powersim.
Consider the dynamics of the target of the model – the integral indicator of competitiveness of the region:
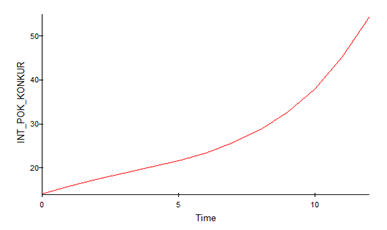
Figure 2. The dynamics of the integral indicator of regional competitiveness
Indicator of the competitiveness of the region has a positive trend. For example, in 2008 value was at around 14.17 in 2012 reached 28.77, and in 2016 plans to increase the rate to 54.57.
A major shortcoming of existing instruments of regional policy is that in Ukraine there are still no clear separation of instruments. This is due, on the one hand, the process of form the most of regional policy, on the other – the instability of the legislation on regional policy.
Thus, regulation of regional development should be aimed primarily at strengthening the competitive relationship in the first place, by reducing direct financial assistance and transfer to the predominant use of incentives and guarantees.
Conclusions
In the process of writing a master's works were studied theoretical foundations of competitiveness management objects of the regional economic system. It was determined that in the "new economy" regional competitiveness has become one of the priorities for its social and economic development and at the same time the subject of a fundamental economic analysis.
Also, held analysis of the competitiveness of the region.
Developed a predictive model showed that the rate of economic development in the region decreased during the crisis (2008–2009 years), but the further dynamics of the index tends to increase.
According to the results, to improve the management of regional development must provides a mechanism for increasing the competitiveness of the region. Determined that the state's regional policy should be directed to the efficient use of the capacity of the region to achieve the strategic goals and objectives of sustainable socio-economic development of the country. Regional development should be aimed primarily at strengthening the competitive relationship in the first place, by reducing direct financial assistance and transfer to the predominant use of incentives and guarantees.
References
- Белецкая И.И. Конкурентоспособность в ее современной трактовке / И.И. Белецкая // Актуальні проблеми економіки. – 2004. – №10 – С. 81–88.
- Гавура В.О. Інструментарій оцінки конкуреноспорможності регіонів / В.О.Гавура // Економічний форум. – 2011. - №4.
- Клебанова Т.С., Дубровина Н.А., Полякова О.Ю., Раевнева Е.В., Милов А.В., Сергиенко Е.А. Моделирование экономической динамики: Учебное пособие. – 2-е изд., стереотип. – Х.: ИД «ИНЖЭК», 2005. – 244 с.
- Лазарєва Є.В. Методичний підхід до оцінки конкурентоспроможності регіону / Є.В.Лазарєва, Н.В.Яблонська // Регіональна економіка. – 2011. - №1. – С.23-31.
- Сидоренко В.Н. Системная динамика. – М.: Экономический ф-тет МГУ; ТЕИС, 1998. – 208 с.
- Ушвицкий Л.И. Конкурентоспособность региона как новая реалия: сущность, методы оценки, современное состояние / Л. И.Ушвицкий, В.Н. Парахина // Сборник научных трудов СевКавГТУ. – 2005. – № 14. С. 41-48.
- Фатхутдинов Р.А. Стратегическая конкурентоспособность: Учеб. / Р.А. Фатхутдинов – М.: ЗАО «Издательство «Экономика», 2005. – 504 с.
- Форрестер Дж. Основы кибернетики предприятия (индустриальная динамика): Пер. с англ. – М.: ПРОГРЕСС, 1971. – 340 с.
- Чайникова Л.Н. Разработка методики оценки конкурентоспособности региона / Л.Н.Чайникова // Вопросы современной науки и практики. – 2008. - №4(14). Том.1. – С.154-166.