Fig. 1a: The first algorithm results
Автор: Jan Machek, Jan Havlik.
Источник: IEEE TRANSACTIONS ON BIOMEDICAL ENGINEERING, VOL. 34, NO. 12, december 2006.
In this article, the algorithms for movement detection in the accelerometer data are described. Two algorithms for movement detection in signal were designed. The purpose of these algorithms is to detect the start and end of the changes which represent movements sections in data. The ways of approaching this issue include second differentiation, points of the inflection, CUSUM algorithm and peak detection. The algorithms were tested on the accelerometer data which were acquired during human body movements. The body movements were based on exercises from Tinneti’s balance assessment tool. Moreover the next test data were acquired during rehabilitation exercises after hip joint replacement. The automatic method for angle range computation were designed and tested on this data as well.
The inertial sensors like accelerometers have wide range of the applications. The one of the possible ways how to use them is detection of the human body movements or postures [1, 2].
The accelerometer sensors could be applied in the patient’s rehabilitation diagnostic for various kind of diseases for example joint rehabilitation process [3]. They can be applied in treatment process as well. The one of the application is the diagnostic exercises from the Tinneti’s balance assessment test tool [4]. The next applications are rehabilitation exercises after the hip joint replacement [5].
In addition the acquired data should to be processed for next applications. The automatic detection of movements in acquired accelerometer signal could be used for improving the patients diagnostic and treatment.
This article describes design of the two robust algorithms. These algorithms were tested on real acquired data from human body movements.
The first test data were measured by accelerometer sensors that were placed on human body during exercising the Tinneti’s balance assessment tool tests. The second data were acquired during rehabilitation exercises after hip joint replacement.
In addition the special angle range computation method were designed and tested on this data from exercises after hip joint replacement. This method was compared with hand computed results from article [5]
All tested methods on the various types of signals are discussed in the conclusion of this contribution.
The first algorithm is based on calculus basics. First of all the signal has to be filtered, because it contains a lot of noise. To filter the base signal finite impulse response (FIR) low-pass filter is applied. Considering the fact that the goal of the algorithms design was not the optimization, used FIR filter is high-order. That way the signal can be as clean as it is possible without any construction limitations. After the base signal is filtered, it is differentiated and then differentiated again. To smooth the second differentiation down the FIR low-pass filter is applied again
Now, the points of inflection can be found. The point of inflection is a point on a curve at which the second differentiation equal zero. Also it is a point on a curve at which the curvature or concavity changes sign
There are usually several inflection points, but only a few marks out a major change in signal.
To find those major change points the algorithm loops over all inflection points.
When an inflection point is examined the algorithm compares the mean value of that point left base signal curve neighborhood and the mean value of the right neighborhood.
If one of those means is higher than the other multiplied by a positive constant it is a point of change in signal.
If the left mean value is greater than the right mean value it means the change in the signal is negative and if the right mean value is greater than the left mean values it means the change is positive.
In this part only the outer points of the whole change curve are examined.
The size of the left and right neighborhoods and the multiplication constant were determined experimentally.
The second approach is similar. First the base signal is smoothed down by finite impulse response low-pass filter. Then CUSUM algorithm is used. CUSUM means cumulative sum which is computed on base of this equation
CUSUM(1) = 0 + (fbs(1) - mu)
CUSUM(i) = CUSUM(i-1) + (fbs(i) – mu)
where “fbs” is filtered base signal and “mu” is the mean of the base signal. Now the second differentiation of the CUSUM curve is computed. Then peaks and valleys are found by using peak detector [6].
To find the start points of the change in positive direction the mean of peaks has to be calculated.
Peaks that are higher than this mean are detected. To fine tune the algorithm there is a constant multiplying the mean value. For every peak detected this way, the closest point of inflection that has lower (time) index has to be found. That is the point of positive change in the base signal
To find the points of negative change the valley lower that all valleys mean has to be detected. The points of negative change are the closest points of inflection that has higher index then the valley.
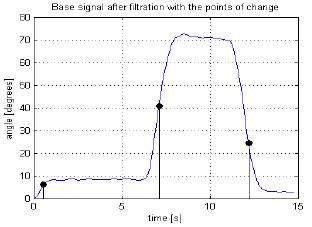
the Figure 1 is shown the measured data and on the x axis points of movement detection which were obtain by the first described algorithm.
The application of the second algorithm on the measured data is displayed in the Figure 2.
The data were measured on accelerometers during exercising the Tinneti’s balance assessment tool tests.
Fig. 1a: The first algorithm results
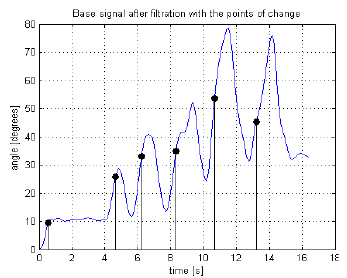
Fig. 1b: The first algorithm results.
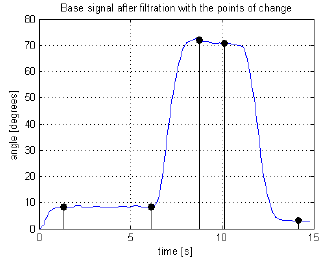
Fig. 2a: The second algorithm results.
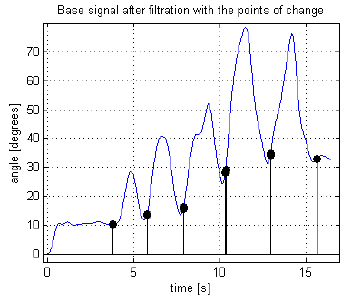
Fig. 2b: The second algorithm results.
To compute the full angle range of the changes in movement the top of each change has to be found.
It is done by a straightforward modification of the two algorithms described in the previous section.
The inner inflection points are noticed as well in the first algorithm.
With the CUSUM algorithm not only the closest points of inflection with lower indices than the peak value indices with the value greater than peak value mean have to be found, but to compute the summits of changes in the base signal the closest points of inflection with higher indices than the peak value indices have to be computed.
The almost same thing has to be done with CUSUM curve valleys lower than all valleys mean. The outer points of change are the inflection points with higher indices than the valleys with value lower then all valleys mean. And then the inner points of change are the inflection points with lower indices than the valleys with value lower then all valleys mean.
Values of major changes in the base signal have to be computed. With the points of base and peak of each change in the signal the change value is the difference between these two points.
Making these algorithms more accurate in the change value computation the constants has been adjusted to detect more points of inflection in the second differentiation of the base signal and in the CUSUM curve.
Then the differences between each two points we have detected is computed.
In the first algorithm values with the same sign between close points are added. This is done due to lowered requirements on the points of inflection detection. Two points of inflection that meet the algorithm requirements can be detected on a single change curve.
With variety of different movement signals in mind only the major changes are noticed. To filter out the minor ones the threshold is set. The threshold value has been set empirically due to the signals the algorithms have been tested on.
Designed algorithms were compared on the real data from human leg movements during a physiotherapeutic exercise after hip joint replacement.
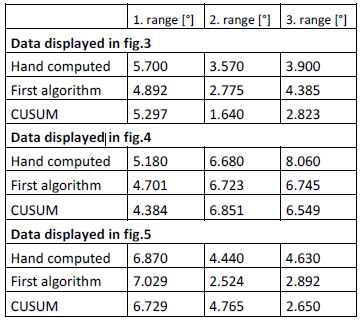
The positive angle changes were computed by the both of algorithms and in hand as well.
The signal data are displayed in the Figures 3, 4and 5.
The final results can be seen in the Tab. 1. For the comparison are in the table listed hand computedresults and values obtained from both designed methods. The hand computed angle ranges were obtained from the article [5].
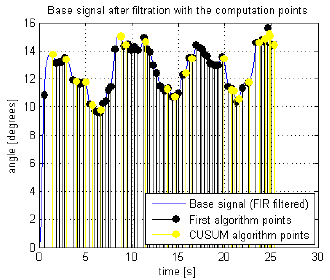
Fig. 3: Computation points in the signal data.
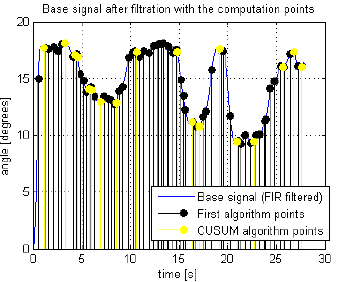
Fig. 4: Computation points in the signal data.
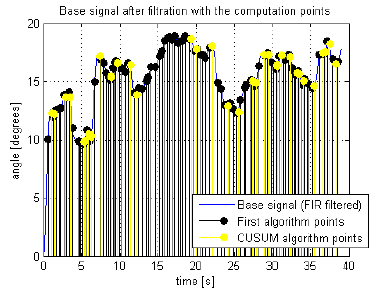
Fig. 5: Computation points in the signal data.
Fig. 5: Computation points in the signal data.
Two algorithms for movement detection in the accelerometer sensor data were designed. The first algorithm is focused on differential signal processing methods and the second is created on CUSUM method.
The both of the designed algorithms were applied on real data and have very good results
The algorithm for angle range computation was designed as well. It was tested on real data as well.
Proposed algorithms were compared with each other and with experimentally hand computed values. The results are presented in the table above.
The first algorithm show better accuracy than the CUSUM method. However the CUSUM method is much more stable and robust and fits better.
In the future the algorithms will tested on other accelerometer data from patient’s rehabilitation and treatment process. The results of designed algorithms will be compared with other change detection methods like Bayesian changepoint detection or Shewhart Control Charts.
1.F. Ioana-Iuliana. D. Rodica-Elena, “Detection of daily movements from data collected with two tri-axial accelerometers,” in Proc.34th International Conference on Telecommunications and Signal Processing (TSP), Hungary 2011, p. 376 – 380.
2.Li Qiang, J.A. Stankovic, M.A. Hanson, A.T. Barth, J. Lach, Gang Zhou, “Accurate, Fast Fall Detection Using Gyroscopes and Accelerometer-Derived Posture Information,” in Proc Sixth International Workshop on Wearable and Implantable Body Sensor Networks, USA 2009, p.138 - 143.
3.J. Martin-Moreno, D. Ruiz-Fernandez, A. Soriano-Paya, V. J. Berenguer-Miralles, “Monitoring 3D movements for the rehabilitation of joints in physiotherapy,” in Proc 30th Annual International Conference of the IEEE Engineering in Medicine and Biology Society, Canada 2008, p. 4836 – 4839.
4.J. Parak, L. Talackova, J. Havlik, L. Lhtoska, “Rehabilitation of patients using accelerometer: First experiment”, Lekar a technika, 2012, vol. 2, pp 65 – 68.
5.L. Talackova, J. Parak, J. Havlik, L. Lhtoska, in Proc. Smart Homes 2012, Prague 2012 (in press).
6.Mike Brooks. (2005). Peak detector. [Online]. Available: http://www.ee.ic.ac.uk/hp/staff/dmb/voicebox/doc/voicebox/fin dpeaks.html