
Rationale, development and research of a laser rangefinder for machine vision systems of robotsContent
IntroductionThe general part of considering ways and means to measure distances, analyzed requirements for machine vision robots selected measurement method, the description of the prototype and carried out the main tasks of work. As part of the project considered generalized structure of a laser range finder. The issues that are technically difficult to implement in practice is to provide high gain and the difficulties of detecting the phase of the reflected signal for high frequency. To overcome these problems are proposed for the direct conversion of the RF signal frequency measurement frequency down to the sound frequency. Also offers a block diagram and formulate the requirements for individual nodes, a method for determining the phase shift. The developed rangefinder must measure distance phase method. The advantage lies in the fact that the phase of laser rangefinders have higher measurement accuracy as compared to pulsed devices, and also their manufacturing cost, and accordingly the price is much lower. As a basis for solving this problem using scientific – technical documentation and report on industrial practice. ActualityCurrently relevant is the task of measuring distances in machine vision systems of robots. In simple machine vision systems robots are widely used ultrasonic and infrared range finders. However, their biggest drawback is the low spatial resolution due to the general pattern of emitters. This deficiency deprived laser rangefinders. As they use a laser emitter, which provides an extremely narrow radiation pattern and high accuracy of the distance to the object. Research goals and objectivesaim of this study is the rationale, development and research of a laser rangefinder for machine vision systems, robots, which is implemented by the phase method. To achieve this goal in the formulated and solved the following problems: unsubstantiated structure rangefinder, made calculations and modeling of electrical components rangefinder, conducted studies of the phase detector, the prototype of the investigations. Object of study: a device for measuring distances in machine vision systems of robots. Subject of research: a laser rangefinder for machine vision systems of robots. Research Methods: analysis and synthesis, mathematical modeling and simulation, scientific eksperiment. Scientific novelty of the results1. Proposed to use a method of direct conversion of the frequency of the reflected laser signal for lowering the frequency of the measurement signal for the purpose of further amplification and phase detection. 2. Proposed use of modern DDS-generators with Direct Digital Synthesis frequencies that allow to change the operating frequency of the radiation, it is necessary to overcome the lack of a phase detector, due to the ambiguity of the output signal depending on the measured phase difference (from a distance). Practical significance of the results: 1. Reasonably structural and functional circuits laser rangefinder for machine vision systems, robots. 2. Proposed to determine the phase shift of the measuring signal directly by the microcontroller allows to simplify the scheme, excluding the low pass filter and ADC, and to improve the accuracy of measurement results from the independence of the frequency of clock pulses. 3. The calculation and modeling of electrical components of the laser rangefinder. The simulation results confirm the theory well. Main sections of were tested at a scientific seminar The result of the two published thesis on scientific and technical conferences. 1. Requirements, methods and objectives for the development of a laser range finder1.1. Setting requirements for laser rangefinderLaser rangefinder must meet the following requirements: 1. Range of measured distances from 0.3 m to 5 m. 2. Measurement error is not more than 1 cm. 3. Power of the laser radiation is not greater than 5 mW. 1.2. Selecting the measurement methodPrinciple of operation rangefinder physical type is to measure the time it takes for a signal sent rangefinder passing distance to the object and back. The ability of electromagnetic radiation propagate with constant speed enables to determine the range to the object [1-7]. There are several methods of measuring range: 1. Triangulation method. 2. Frequency. 3. Pulse method. 4. Phase method. The developed laser rangefinder invited to perform but based on the phase method. The phase measurement method is based on determining the distance of the phase difference sent and received modulated signals. Operating mode of the device depends on its temperature, with the change that the signal phase changes insignificantly. Consequently, the exact origin of the phase can not be determined. For this purpose, the phase measurements are repeated on the reference interval (calibration line) inside the device. The main advantage of the phase measurement method – higher accuracy, which can reach several millimeters [2]. 1.3. Implementation Issues and ways to overcome themDifficulties implementing the selected measurement method lies in the fact that at high frequencies (megahertz) is technically difficult to achieve high gain and further reflected signal phase detection. To overcome proposed receiving apparatus to perform an optical signal reflected by the scheme of direct downconversion of the measuring and reference signals to the sound of 1 kHz. Thus the information about the phase difference signal is preserved [6]. 1.4. ConclusionsThus, in this section we have placed demands on laser rangefinder, method was chosen, which is taken as a basis for the development of a laser range finder, as well as suggest ways to overcome the problems of implementation. 2. Justification structure rangefinderConsider a generalized block diagram of a laser range finder that implements phase method of measuring the distance (Fig. 2.1). 
Figure 2.1 – A generalized block diagram of a laser range finder The method consists in the fact that the object is sent to the modulated laser beam that is reflected from its surface and back . Receiving device processes the received signal and the output from the phase difference of the received signal and determines the distance to the object. Difficulties in realizing this measuring method are that at a high frequency is technically difficult to provide a large amplification of the reflected signal, and further phase detection. To overcome them suggested receptor signal display to perform direct conversion scheme [6] with decreasing frequency measuring and reference signals to the sound of 1 kHz. Thus the information on the phase difference signals is maintained. Figure 2.2 shows a functional diagram of the developed rangefinder. 
Figure 2.2 – Functional diagram of a laser rangefinder For signal generation uses two high-precision oscillator with frequency Direct Digital Synthesis (DDS) [3]. The main gain of the measurement signal provides low-frequency electronic amplifier with a voltage gain KU = 104. 3. Calculation and simulation of electrical components of the device3.1. Calculation and modeling of selective amplifierIn the proposed scheme rangefinder basic gain of the reflected measuring signal occurs at low frequencies after the frequency mixer. In order to provide voltage gain KU = 104 and reduce noise at 1 kHz was decided to use the scheme T-bridge [4]. Figure 3.1 shows a diagram of a two-stage selective amplifier. Calculate the parameters of T-shaped bridge. Because you want to get the voltage gain KU = 104, is proposed to use a scheme that consists of two stages. Since the voltage gain of the circuit will be determined by the product of the voltage gain stages included in the scheme, we set the gain of each stage KU = 100. 
Figure 3.1 – Scheme of the selective amplifier Known that: Can find: Let C=C6=C7=100 nF, then: For resistance and capacitance bridge the relations: Accepted values or resistors R7=R8=1.6 K. For modeling amplifier circuit (see Fig. 3.2) used SPT Electronics Workbench. The modeling is necessary to check the correctness of calculations and as a result get an amplifier that would provide voltage gain KU=104. To ensure the required voltage gain, the amplifier circuit comprises two stages. First run a simulation stage. Scheme modeled cascade is shown in Figure 3.2. 
Figure 3.2 – Schematic of the first stage in a simulated IFR Electronics Workbench This stage must provide voltage gain KU=100. Construct a frequency response of the amplifier stage, and evaluate its performance. In Figure 3.3 shows the amplitude-frequency characteristic (AFC) of the amplifier stage, the resulting simulation.  of the first amplifier stage")
Figure 3.3 – Amplitude-frequency characteristic (AFC) of the first amplifier stage The figure 3.3 shows that at a frequency of 1 kHz this stage provides voltage gain Ku = 108. As we can see the error of the model does not exceed 10 % and meets the requirements. Perform circuit simulation of the second stage and evaluate its performance. In Figure 3.4 shows a diagram of the second amplifier stage, which is modeled using SPT Electronics Workbench. 
Figure 3.4 – Scheme of the second stage in a simulated IFR Electronics Workbench This scheme at 1 kHz should provide voltage gain KU = 100. Construct the frequency characteristics of the cascade, and evaluate its performance. In Figure 3.5 shows the amplitude-frequency characteristic (AFC) of the amplifier stage, the resulting simulation.  of the second amplifier")
Figure 3.5 – Amplitude-frequency characteristic (AFC) of the second amplifier stage The figure 3.5 shows that at a frequency of 1 kHz this stage provides voltage gain KU = 104. As we can see the error of the model does not exceed 10 % and meets the requirements. Modeled full scheme and evaluate performance of the amplifier. In Figure 3.6 shows the complete circuit of the amplifier, which is modeled using SPT Electronics Workbench. 
Figure 3.6 – Full amplifier circuit This scheme should provide the voltage gain KU = 104. Construct a frequency response of the amplifier, and evaluate its performance. In Figure 3.7 shows the amplitude-frequency characteristic (AFC) of the amplifier, the resulting simulation.  of the complete amplifier circuit")
Figure 3.7 – Amplitude-frequency characteristic (AFC) of the complete amplifier circuit The figure 3.7 shows that the frequency of 1 kHz at this stage provides voltage gain Ku = 1.2*104. How do we see error of the model does not exceed 10 % and meets the requirements [5]. 3.2. Modeling frequency mixerSince measuring the phase difference directly to the high frequency modulation is technically inconvenient used previous decline frequency signals to audio frequencies. Thus the information on the phase difference signals is maintained. The scheme under frequency is shown in Figure 3.8. 
Figure 3.8 – Scheme of underfrequency Suppose, for example, the input signal and the signal from the local oscillator have the form: Then turn on the mixer output signal proportional to the expression: 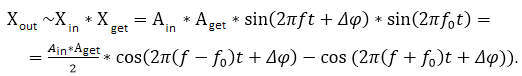
Thus, the signal at the mixer output is the sum of the harmonic signals with frequencies equal to the frequency difference f-f0 and the sum frequency f+f0. Thus the information on the phase difference and is stored in the output signal. Using low-pass filter connected to the output of the mixer is allocated to the difference frequency component f-f0, and other components of the mixer output signal are suppressed. Difference frequency is also called the intermediate frequency. The experimental setup oscillator frequency is selected so that the difference frequency was in the range of sound frequencies (on the order of hundreds of hertz – units of kilohertz). Operation is carried out as reducing the frequency signal coming from the photodetector and a reference signal. Modeled mixer circuit shown in Figure 3.9, to evaluate its work and see that at low frequencies the phase difference information is stored. 
Figure 3.9 – Schematic diagram for the study of the mixer Figure 3.10 shows the waveforms at a frequency of 1 MHz . 
Figure 3.10 – Waveform at 1 MHz Reduce the frequency to 1 kHz and obtain the waveforms shown in Figure 3.11. 
Figure 3.11 – Waveform at 1 kHz Figures 3.10 and 3.11 show that with a decrease in the frequency of the measuring and reference signals to the audio frequency of 1 kHz phase difference information is stored. Define how the output level depends on the level of the mixer local oscillator signal for the circuit shown in Figure 3.12. 
Figure 3.12 – Diagram for determining the dependence of the output signal from the mixer signal level Construct a graph of given in Figure 3.13. 
Figure 3.13 – Dependence of the output level of the mixer on the level of the local oscillator signal Study showed that the output level of the mixer increases with decreasing signal level at the local oscillator. Define how the output level depends on the level of the mixer local oscillator signal for the circuit shown in Figure 3.14. 
Figure 3.14 – Diagram for determining the dependence of the output level of the mixer LO signal level Construct a graph of (see Fig. 3.15.) 
Figure 3.15 – Dependence of the output level of the mixer on the level of the local oscillator signal Study showed that the output level of the mixer practically does not vary with the level of the local oscillator signal , in contrast to the circuit shown in Figure 3.12. 4. Investigation of the phase detectorConsider the phase detector circuit as depicted in Figure 4.1. Phase detector assembled on a logical element DD1 (XOR) and the RC-filter of first order lowpass. 
Figure 4.1 – Functional diagram of the phase detector The input of the phase detector receives the measuring and reference signals. On leaving DD1 formed pulses whose duration is proportional to the phase shift of the input signals (see Fig. 4.2). 
Figure 4.2 – Oscillograms of signals at the control points RC-filter suppresses the variable components and extracts the useful signal in the form of a constant level [10]. Figure 4.3 shows the dependence of the signal level at the output of the phase detector from the measured distance (phase shift) for the modulation frequency signal F=15 MHz. 
Figure 4.3 – Dependence of the signal level at the input of the phase detector from the measured distance The figure shows that this dependence is periodic. At the same time, there is a complexity of decoding testimony because of the ambiguity. For example, according to figure 4.3, the output signal level U=Umax/2 would correspond to the distances of 2.5 m, 7.5 m, 5.12 m. [8]. Most effective way to overcome this drawback is to perform additional measurements at a lower frequency modulation. If the level in the signal at the phase detector output is proportional to frequency decreases, it means that the object distance is not greater than 5 meters limit, otherwise the result is outside the range of measurement will be omitted. Consider a method of measuring the phase difference directly without using a microcontroller and ADC LPF. The method is based on measurement by a microcontroller on the input pulse width DD1, T period and then calculating the phase difference according to the formula: For measurements t and T used in an integrated microcontroller timer. Since it uses the ratio (t/T), then any change in frequency clock will not affect the accuracy of measurements. Consider flowchart of determining a phase difference method proposed above (see Fig. 4.4). 
Figure 4.4 – Block diagram of the phase detection through mikrokntrolera On phase detection system served two signals. At the time of the passage of one signal through zero the timer. In this time interval timer starts counting cycles of the pulse generato. When the second signal reaches zero – will be stored in the timer number that corresponds to the phase difference of the reference and the measured signal and the timer reset. This number is used to calculate the phase difference. When using AVR MC with 16 MHz resolution in the measurement of time intervals is 62.5 ns, which allows a 16-fold increase in accuracy relative to the first mode ADC [9]. ConclusionBasic scientific findings and results of the work are as follows: 1. The analysis methods for measuring distances. The advantages and disadvantages of each method. The analysis showed that the most suitable method for the development of a laser range finder is the phase shift method. 2. The basic specifications for a laser rangefinder . 3. During execution of the project were considered a generalized block diagram of a laser range finder , as well as problems were identified , which are technically difficult to implement – is to ensure high gain and phase for the difficulties of detecting the reflected signal of high frequency. To overcome these problems, a method was used in measuring the direct frequency conversion from the RF signal down to an audio frequency. Information about the phase difference that it retained. Has also been developed and refined a block diagram formulated requirements for individual structural units. Generators direct digital frequency synthesis is possible to change the modulation frequency of the radiation, it is necessary to overcome the lack of a phase detector, due to the ambiguity of the output signal depending on the measured phase difference. 4. The calculation and modeling of the selective amplifier laser rangefinder. The simulation results confirm the theory well. 5. Definition of the phase shift between the reference and measuring signals reflected by the microcontroller serves to perform the direction that eliminates the LPF and ADC, and to improve the accuracy of measurement results from the independence of the frequency of clock pulses. In writing this essay master's work is not yet complete. Final completion: December 2014. Список источников
|