Назад в библиотеку

Pipelining vs. Multiprocessors – Choosing the Right Network Processor System Topology

Авторы: Ning Weng, Tilman Wolf

Описание: В статье рассматриваетсыя выбор топологии сетевого процессора

Источник: Ning Weng, Tilman Wolf – Pipelining vs. Multiprocessors – Choosing the Right Network Processor System Topologyhttp://www.researchgate.net/publication/228845543_Pipelining_vs._multiprocessors-choosing_the_right_network_processor_system_topology/file/e0b4951afa445c5707.pdf

Pipelining vs. Multiprocessors – Choosing the Right Network Processor System Topology

Ning Weng and Tilman Wolf

Department of Electrical and Computer Engineering

University of Massachusetts at Amherst

{nweng,wolf}@ecs.umass.edu

Abstract

Computer networks provide an increasing number of ser- vices that require complex processing of packets, for example firewalls, web server load balancing, network storage, and TCP/IP offloading. Such services are typ- ically limited to the network edge, but still require the use of powerful network processors to provide the neces- sary performance and flexibility. To keep up with these demands, next generation network processors will pro- vide dozens of embedded processor cores. One impor- tant question is which system-on-a-chip topology is most suitable for such a highly parallel system. Due to the in- herent parallelism in network traffic, the design space for this problem is vast and ranges from pipelined to multi- processor solutions. In this work, we present a method- ology to explore this design space through performance modelling. It is crucial that such a model considers the NP workload in detail as the distribution of processing steps over the system has significant impact on system throughput. We present a mechanism for mapping the workload optimally to an arbitrary topology based on run-time traces. Our performance model determines the system performance and considers the effect of on-chip communication as well as off-chip memory accesses. We present results from several NP applications, show the performance tradeoffs between different system topology, and identify system bottlenecks.

1 Introduction

The Internet has progressed from a simple store-and- forward network to a more complex communication in- frastructure. In order to meet demands on security, flex- ibility and performance, network traffic not only needs to be forwarded, but also processed inside the network. Such processing is performed on routers, where port pro- cessors can be programmed to implement a range of functions from simple packet classification (e.g., for fire- walls) to complex payload modifications (e.g., encryp- tion, content adaptation for wireless clients, or ad inser- tion in web page requests).

To provide the necessary flexibility for increasingly complex network services at the edge, router designs have moved away from the hard-wired ASIC forward- ing engines. Instead, programmable “network proces-

sors” (NPs) have been developed in recent years. These NPs are typically single-chip multiprocessors with high- performance I/O components. Network processor are usually located on a physical port of a router. Packet processing tasks are performed on the network proces- sor before the packets are passed on through the router switching fabric and through the next network link. This is illustrated in Figure 1.

To meet the performance demands of such a system it is important to exploit the inherent parallelism of net- work processing. Due to limitations in clock rates and memory access speeds, a single processor cannot meet the processing requirements for a Gigabit router system. Instead, network processors use multiple processing en- gines that process packets in a parallel of pipelined fash- ion. Most packets in network traffic do not exhibit inter- dependencies and thus can be processed independently. This allows network processors to employ highly paral- lel architectures that are optimized for packet through- put. This is very different from the goals of workstation or server processors, which aim at optimizing single-task performance.

One of the key architectural aspects of a network pro- cessor is the system topology that determines how pro- cessing engines are interconnected and how parallelism is exploited. This is an important characteristic as it de- termines the system performance as well as the overall scalability of the architecture. In principle, there are sev- eral approaches to arranging processing engines: in par- allel, in a pipeline, or a hybrid configuration. The goal of this paper is to model and quantify the system perfor- mance of these approaches. The results allow us to un- derstand the tradeoffs between different topology, iden- tify optimal solutions, and find bottleneck components in the system. The impact of this exploration is illustrated in Figure 2, which shows the throughput speedup of a network processor system versus the number of proces- sors in the system. The details on how the results are derived are explained later in the paper. A given number of processors is arranged in any possible configuration ranging from parallel processors to a complete pipeline. The throughput of the configuration is then evaluated. The main observation is that the performance for a given number of processors can vary by a factor of 2-3. This indicates that the choice of topology does have a consid- erable impact on the overall performance. Another im-


Router


packets


Port


Port


Port


Switching


Fabric


Network Processor


Interface

Processing

Processing


Engine


Engine


NP Port


Port


Interc

nnect


Topology


Processing


Network

Choice


Engine


Processing


Engine


Hybrid Topology


I/O


Proc.

Proc.

Proc.


Multiprocessor Topology


Pipelined Topology


Proc.


Proc.


Proc.


Proc.


Proc.


Proc.


Proc.


Proc.


Proc.


Figure 1: Router System with Network Processors. The processing elements on the network processor can be arranged in various topologies.

processor

18


16

limited scalability


14

speedup from


single


parallelism


12


to


relative

10


8


speedup


6


suboptimal topologies


throughput

4


2


0


infeasible topologies


0

50

100

150

200

250


number of processors


Figure 2: Topology Impact Performance. The system throughput depends heavily on the choice of topology. The results are obtained from the performance model presented in Section 5.

portant observation from Figure 2 is that the scalability of these topologies is limited. For 100 processors, the maximum throughput is only slightly higher than for 50 processors. The performance model that we derive in our work can help identify system bottlenecks (e.g., memory interfaces) and quantify their performance impact.

In order to explore different NP architectures and quantitatively obtain the performance of a particular ar- chitecture, we need to consider the impact of the network processor workload. The workload (consisting of a set of “applications”) determines the processing steps that need to be performed on each packet and thus the overall performance of the system. Our approach to modeling network processor throughput under different topologies and workloads consists of the following three steps:

1.Abstract Application Representation. The work- load needs to be represented in a way that it can be mapped to multiple parallel or pipelined process- ing elements. This requires a representation that ex- hibits the application parallelism while also ensur- ing that data and control dependencies are consid- ered. We use an annotated directed acyclic graph (ADAG) to represent the dynamic execution profile of applications.

2.Application Mapping. Once we have the applica- tion represented as an ADAG, the next step is to map the ADAG onto a NP topology. The goal is to opti- mize system performance while considering all the application dependencies. To approximate a solu- tion to this NP complete problem, a randomization algorithm is used that achieves good results.

3.NP System Performance Modeling. The system performance model is the key component for the de- sign space exploration of different NP topologies. This model considers processing, inter-processor communication, contention on memory interfaces, and pipeline synchronization effects to determine the overall throughput.

We obtain results from an exhaustive evaluation of the entire design space. The results that we obtain can be used in a number of ways:

Understanding the trade-offs involved in selecting different network processor topologies given a par- ticular workload.

Understanding how to optimize and map applica- tions given a particular NP architecture.

Modeling throughput performance of network pro- cessor architectures.

Identify the bottlenecks of the system and deter- mining their quantitative impact on system perfor- mance.

The remainder of this paper is organized as follows. We discuss work related to design space exploration and performance modelling of NP architectures in Section 2. Section 3 describes our methodology and general- ized network processor topology for exploring the design space. Section 4 introduces the ADAG abstraction to de- scribe the workload and map it to the NP topology. The analytic performance model for evaluating an NP system is presented in 5. Results are presented and discussed in Section 6. Section 7 summarizes and concludes the paper.

2 Related Work

The system topology of network processors can be im- plemented in a variety of ways, ranging from a fully pipelined systems to fully pooled multiprocessors. An examples for the pipelined system is the Agere Fast Pat- tern Processor and Routing Switch Processor [19] and for the fully pooled system the Intel IXP2400 [14]. Between them lie the hybrid approaches, or pipeline of pools, with EZchip’s NP-1 [7] as an example. This topic has been explored by Gries et al. [11], who evaluated the per- formance/cost trade-offs for different network processor topologies based on a network calculus approach. The major difference to our work is that we develop a mean value analysis using detailed instruction traces from net- work processor workload simulations.

The design spaces of network processors has been ex- plored in several ways. Crowley et al. have evaluated different processor architectures for their performance under different networking workloads [5]. This work mostly focuses on the tradeoffs between RISC, super- scalar, and multithreaded architectures. In more recent work, a modeling framework is proposed that consid- ers the data flow through the system [4]. Thiele et al. have proposed a performance model for network proces- sors [29] that considers the effects of the queueing sys- tem. In our previous work, we have developed a quan- titative performance and power consumption model for a range of design parameters [8] [9]. All these models require detailed workload parameters to obtain realistic results.

Several network processor benchmarks have captured the characteristics of network processing. Crowley et al. have defined simple programmable network inter- face workloads [5]. In our previous work, we have defined a network processor benchmark called Comm- Bench [32]. Memik et al. have proposed a similar bench- mark more recently [21]. All these benchmarks are use- ful in that they define a realistic set of applications, but are limited in how much detail of workload characteris- tics can be derived. We have addressed this shortcom-

ing with a very detailed and network-processor-specific analysis of such benchmark applications that goes be- yond simple microarchitectural metrics. In our recent work, we have developed PacketBench [26], which is a network processing simulation environment that can de- rive detailed instruction traces of packet processing ap- plications. These run-time traces can be used to explore simple application metrics as well as more complex pro- cessing task dependencies. These dependencies are im- portant information when distributing processing task to multiple processing engines.

Mapping of task graphs to multiprocessors is a well explored research area, which has been surveyed by Kwok and Ahmad [17]. Since finding an optimal map- ping is an NP-complete problem in general, researchers have relied on devising efficient heuristics. However, it is in a general conflicting goal to design a mapping algo- rithm with low computation time but high quality. One promising approach is to use randomization. As indi- cated by Karp [15] and Motwani and Raghavan [22], an optimization algorithm which makes random choices can be very fast and simple to implement. Recently, Lakam- raju et al. [18] have applied this idea to synthesizing networks that satisfy multiple requirements. Their re- sult demonstrates that randomization is a powerful ap- proach that can generate surprisingly good results. Also, Kwok [16] has used random neighborhood searching techniques to propose a Bounded Number of Processors (BNP) scheduling algorithm. We also use a randomized algorithm for our task mapping problem.

The delay effect caused by the memory interference in a parallel processing system with a shared memory has been well investigated. Specific solutions are provided in [2] [12] [10]. Methods have also been developed that provide lower bounds on response times for parallel sys- tems with deterministic service time [30].

3Network Processor Design Space Exploration

The modeling of network processor performance re- quires an abstract representation of NP architectures. We introduce a general NP architecture that allows us to ana- lytically model the NP performance and compare differ- ent architectures.

3.1General Network Processor Topology

Network processors exhibit a large diversity in architec- ture with system topologies ranging from simple multi- processors to complex data flow pipelines. In order to explore this large design space in a general way, we in- troduce a network processor architecture that features the main characteristics of NPs while abstracting away some of the system details.

We use a general, parameterized network processor topology shown in Figure 3. The system topology is characterized by three components: processing elements,

tion of the workload such that it can be mapped to any given NP. This representation should capture the run- time properties of the application at sufficient detail to al- low the identification of parallelizable application parts. We have chosen an annotated directed acyclic graphs (ADAG) for this purpose.

4.1ADAG Generation

Our approach to generating the ADAG is to analyze the run-time characteristics of NP applications and build the application representation “bottom-up.” The anno- tations indicate the processing and I/O requirements of each block and the strength of the dependency between blocks. We consider each individual data and control dependency between instructions and group them into larger clusters, which make up the ADAG.

4.1.1Run-Time Trace Generation

In order to obtain runtime analysis of application pro- cessing, we use a tool called “PacketBench” that we have developed [26]. The goal of PacketBench is to emulate the functionality of a network processor and provide an easy to use environment for implementing packet pro- cessing functionality. One key benefit of PacketBench is the ease of implementing new applications. The architec- ture is modular and the interface between the application and the framework is well defined. New applications can be developed in C, plugged into the framework, and run on the simulator to obtain processing characteristics.

The PacketBench executable is simulated on a typical processor simulator to get statistics of the number of in- structions executed and the number of memory accesses made. We use the ARM target of the SimpleScalar [3] simulator, to analyze our applications. This simulator was chosen because the ARM architecture is very sim- ilar to the architecture of the core processor and the mi- croengines found in the Intel IXP1200 network proces- sor [13], which is used commonly in academia and indus- try. The tools were setup to work on an Intel x86 work- station running RedHat Linux 7.3. PacketBench supports packet traces in the tcpdump [28] format and the Time Sequenced Header (TSH) format from NLANR [23].

The run-time traces that we obtain from PacketBench contain the instructions that are executed, the registers and memory locations that are accessed, and an indica- tion of any potential control transfer. Using these traces we build an ADAG that considers dependencies among instructions as well as allows us to discover any potential parallelism. The trace also provides detailed memory ac- cess statistics which are essential to obtain accurate re- sults using our performance models. Since we make no assumption on the processing order other than the depen- dencies between data, we are able to represent the appli- cation almost independently from a particular system.

This approach differs from conventional, static call- graph analysis. One of the key points of this work is that the ADAG can be created completely automatically from a run-time instruction trace of the program on a uni-

processor system. Once this is done, the iteration over the design space can be performed rapidly unlike trace based evaluation which would require a new trace to be gener- ated for each variation in architecture. This is due to the fact that our ADAG is an architecture independent rep- resentation of the processing required by an application. The drawback to using a dynamic instruction trace is that each packet could potentially execute a different set of instructions depending on the values contained within. Since most packets do exhibit the same processing trends (i.e., fast path processing), we believe that the inaccuracy introduced by using a dynamic trace does not impact the overall results.

4.1.2ADAG Clustering

The ADAGs that are directly derived from the instruc- tion traces contain a large number of instructions and ba- sic blocks (i.e., nodes in the ADAG). Their processing requirements can range from a single instruction to sev- eral dozen. In order to make the ADAGs more tractable and allow an efficient mapping process, we use an ADAG clustering algorithm to group instruction sequences. The resulting ADAG contains a smaller number of instruc- tions, but still reflects all the dependencies, processing, and I/O requirements of the original ADAG.

Finding an optimal clustering of the ADAG nodes is an NP-complete problem. We have developed a heuristic called “Maximum Local Ratio Cut” (MLRC) [25], which is based on the “ratio cut” metric introduced by Wei and Cheng [31]. This clustering method achieves a natural clustering of nodes through minimizing the inter-cluster dependencies, while maximizing cluster size of cohesive nodes.

For the purpose of exploring pipelined network pro- cessor topologies, it is crucial that the processing tasks in each pipeline stage are roughly balanced. The syn- chrony enforced by the pipelining paradigm reduces the pipeline speed to the slowest stage. Large differences in the amount of processing will cause an inefficient NP system. In order to enforce such a balance, we fur- ther constraint the MLRC algorithm to minimize the pro- portions between the largest and the smallest processing task.

4.1.3Sample Applications

For this work, we explored four applications that are typ- ical of network processor workloads. These applications are:

IPv4-radix. IPv4-radix is an application that per- forms RFC1812-compliant packet forwarding [1] and uses a radix tree structure to store entries of the routing table.

IPv4-trie. IPv4-trie is similar to IPv4-radix and also performs RFC1812-based packet forwarding. This implementation uses a trie structure with com- bined level and path compression for the routing ta- ble lookup [24].

Flow Classification. Flow classification is a com- mon part of various applications such as firewalling, NAT, and network monitoring. The packets pass- ing through the network processor are classified into flows which are defined by a 5-tuple consisting of the IP source and destination addresses, source and destination port numbers, and transport proto- col identifier.

IPSec Encryption. IPSec is an implementation of the IP Security Protocol, where the packet payload is encrypted using the Rijndael algorithm [6], which is the new Advanced Encryption Standard (AES).

After simulating these applications, collecting run-


time traces, identifying data and control dependencies,


and clustering instructions to processing tasks, we ob-


tain the ADAGs shown in Figure 5. A node represents a


processing task and an edge shows a dependency (con-


trol and/or data). The annotation in a node consist of the


node name and a 3-tuple that contains the number of in-


structions that are executed, the number of reads to mem-


ory and the number of writes to memory. The reads and


writes to memory are only for data that is used for the first


or the last time by the application. Data that is moved


between processing tasks is shown as edge weights on


the dependencies. Rectangular nodes identify the start-


ing node, bold nodes indicate the terminating nodes.


The ADAGs display the inherent characteristics of the


applications. IPv4-radix and IPSec highly sequential ap-


plications, which is due to data dependent processing.


IPv4-trie and Flow Classification show a bit more par-


allelism.

(a) IPv4-radix

(b) IPSec

4.2ADAG Mapping

The mapping process is the first step in the actual de- sign space exploration. The goal is to map one or mul- tiple ADAGs to an instance of the generic NP system topology in such a way as to maximize the optimiza- tion criterion. This is not an easy task because the map- ping process needs to consider the dependencies within an ADAG and ensure that a correct processing of pack- ets is possible. Further, the mapping can have signif- icant impact on the overall system performance. In a pipelined system, the performance depends on the speed of the slowest pipeline stage. By distributing process- ing tasks evenly over the available processing elements, a better system performance can be achieved. In this work, we use the system throughput as the performance metric. The throughput is determined by the performance model described Section 5 and depends on the processing that is performed in each stage of the pipeline, the communi- cation between stages, and the delay caused by off-chip memory accesses.

Unfortunately, the problem of finding an optimal map- ping solution is NP complete. Malloy et al. established that producing a schedule for a system that includes both execution and communication cost is NP-complete, even if there are only two processing elements [20]. Therefore

(c) IPv4- (d) Flow Classification trie

Figure 5: Annotated Directed Acyclic Graphs (ADAGs) for Workload Applications. The annotation in a node is the node name and a 3-tuple (processing/reads/writes). The weight on the edges is the number of data and control dependencies between nodes.

we need to develop a heuristic to find an approximate so-


current maximum


3.6


individual run


lution.


per kilocycle


Our heuristic solution to the mapping problem is based


3.5


on randomized mapping. The key idea is to randomly


3.4


choose a valid mapping and evaluate its performance.


packets


By repeating this process a large number of times and


3.3


picking the best solution that has been found over all it-


in


throughput


erations, it is possible to achieve a good approximation


3.2


to the global optimum. The intuition behind this is that


3.1


any algorithm that does not consider all possible solu-


tions with a non-zero probability might get stuck in a lo-


1

10


100


1000


10000

cal optimum. With the randomized approach any possi-


number of iterations


ble solution is considered and chosen with a small, but

Figure 6:

Randomized


Mapping.

Throughput


over

non-zero probability. This technique has been proposed


and successfully used in different application domains by

10,000 randomized mapping runs.


Karp [15], Motwani [22], and Lakamraju et al. [18].


We break the mapping algorithm into two stages: map-

Figure 6 shows the range of solutions that are derived

ping and filtering. In the mapping stage, we randomly

in this process. The x-axis shows the iteration of the map-

allocate an ADAG node (i.e., a processing task) to an

ping algorithm. The y-axis show the performance of a

empty processing element in the NP topology.

If the

particular solution. The solid line indicates the best so-

mapping violates the dependency constraints, we repeat

lution up to a given iteration that has been found in the

the mapping until a valid mapping has been found or a

filtering stage. The logarithmic scale of the x-axis high-

certain number of attempts has been reached.

This is

lights that a large number of iterations are necessary to

repeated until all nodes of an ADAG have been placed

get incrementally better results once a few hundred or

into the topology. The ADAG mapping is repeated until

thousand iterations has been exceeded.


the NP topology is “full” (i.e., no ADAG can be added

Altogether, randomized mapping is a very suitable ap-

successfully). The mapping is then moved to the filter-

proach to solve the problem of NP completeness of map-

ing stage where the performance of the mapping is deter-

ping ADAGs to complex NP topologies. Since we use

mined and compared to prior maps. If the new mapping

analytic performance modeling rather than simulation to

is the best solution in terms of the optimization metric

determine the throughput of a system, we can quickly

it is recorded for comparison to future solutions. Other-

determine the quality of a mapping solution and iterate

wise it is discarded. At the end of the mapping process,

over a large number of possible solutions. This would

the best overall mapping is reported.


not be possible if more time consuming simulation based

The execution time and accuracy of the mapping al-

modeling was used.


gorithm is determined by the parameters that determine


how persistent the algorithm is about finding a solution.

5


Performance Model


Our solution uses two such parameters: the maximum


node failure counter and the maximum ADAG failure


counter. The node failure counter counts how many

The performance model for the general NP topology

times it has been attempted to map a particular node to

provides an analytic expression for the system through-

the NP topology. Due to topology and ADAG depen-

put. After mapping the application ADAGs to the net-

dency constraints, a valid mapping might not be possi-

work processor topology, we know exactly the workload

ble. Thus, when the maximum value for the node fail-

for each processing element. This information includes

ure counter has been reached, the attempt to map the

the total number of instructions executed, the number of

ADAG to the topology is aborted. This event counts as

memory accesses, and the amount of communication be-

an ADAG failure. When the maximum number of ADAG

tween stages. Thus, the model needs to take this into ac-

failures have been reached, the the topology is consid-

count as well as contention for shared resources (memory

ered full and the mapping is passed on to the filtering

channels and communication interconnects).


stage. The node failure counter and the ADAG failure


counter are reset after each successful mapping of a node

5.1


Throughput


or an ADAG respectively.


To reduce the number of unsuccessful mapping at-

The system throughput is determined by modeling the

tempts, certain additional heuristics are employed. For

processing time for each processing element in the sys-

example, the child nodes of a given ADAG node can only

tem based on its workload, the memory contention on

be mapped to processing stages after the current node

each memory interface, and the communication over-

(otherwise there is an immediate dependency violation).

head between stages. We are particularly interested in

Thus, the random choice of processing elements is lim-

the maximal latency, τstagemax , since the critical stage

ited to those stages. This does not impact the correctness

of the pipeline architecture determines the overall sys-

of the algorithm, but improves the probability that a bet-

tem speed. The number of ADAGs that are mapped to

ter mapping is found.


an architecture, nADAG, determines how many packets

are processed during any given stage time. With a sys- tem clock rate of clk, the throughput of the system can be expressed as

throughput = nADAG ·

clk

,

(1)


τstagemax

where

D

τstagemax = max τstagei . (2) i=1

The maximum stage time is the maximum time that any of the D stages spends on processing, memory ac- cesses, and communication.

Zi, depends on the proportion of memory accesses (i.e., load and store instructions) to the number of non-I/O in- structions. Each processing element requires ri,j read and wi,j write operations from/to the memory interface (given by the ADAG). Zi is calculated over the entire stage i because memory channels are shared:


W


Zi =

j=1 instri,j

.

(5)

W

(ri,j + wi,j)


j=1


There is no closed form solution for the Machine Re- pairman system. Instead the result is computed incre- mentally over the number of job servers N . The response time for a system with n job servers is [27]:

5.2Stage Time

The time that is required for a stage depends on the max- imum time that any processing element spends for pro- cessing, accessing memory, and communicating. The processing time is τproci,j with 1 i W and 1 j D for processing element i in stage j. Each pro- cessing element spends τmemi,j for memory accesses, which depends on the contention on the memory inter- face.. The communication time, τcommi , is determined by how much data has to be transferred between stages. Thus the total stage time can be expressed as

W

τstagej = τcommj + max (τproci,j + τmemi,j ). (3) i=1

In network processors, most processing elements are RISC-style processing cores. For such processors it can be assumed that one instruction is executed per clock cy- cles. Thus the processing time depends solely on the number of instructions, instri,j that are mapped to this processing element during the mapping phase:

τproci,j

=

instri,j

.

(4)


clk


Modeling the communication time and memory access time are more challenging since these components are shared among multiple processing elements.

5.3Memory Access Time

The memory access time is the sum of the queuing time due to contention and the actual memory access time. The queuing system can be modelled by a Machine Re- pairman model with a fixed number of sources (i.e., pro- cessing elements) and a certain number of servers (mem- ory channels). When a memory access is issued, the pro- cessing element stalls until the request has been served. A mean value analysis of this queuing model can be found in work by Reijns and van Gemund [27]. We adopt the notation introduced by them.

To determine the memory access time we derive the system response time, RN . N is the number of process- ing elements that share memory interfaces and M is the number of memory interfaces shared by those process- ing elements. The mean time between memory requests,


S


2


Rn = S + SQn−1


Un−1

[1

Un−1][


Rn−1

1],

2

S

(6) where S is the service time of the server (i.e., memory access time), U is the utilization of the server, and Q is the number request present at the memory interface (including the current one served). U is defined as

Un−1 =

SXn−1


(7)

M


and Q as


Q

=

Xn−1Rn−1

,

(8)

n−1


M


with X being the system throughput. X depends on the response time of the system and the mean time between requests:

Xn−1 =

n 1

.

(9)


Rn−1 + Z


This allows a recursive calculation of Rn. The ini- tialization values are R1 = S and Q0 = 0. With the response time RN , the overall memory access time for a processing element can be determined:

τmemi,j = Rn · (ri,j + wi,j).

(10)

This model can be used for a range of memory tech- nologies. By adapting the service time S, different mem- ory technologies can be modelled. E.g., S = 1 could model an on-chip cache, S = 10 off-chip SRAM, and S = 100 off-chip DRAM.

5.4Communication Time

The communication time of a stage depends on the to- tal amount of data that needs to be transferred across the interconnect. The mapping of the ADAG yields information about data dependencies between different processing elements (indicated by arrows in Figure ??. The amount of data that needs to be communicated be- tween processing element (i, j) and (i, j) depends on the weight of the edge (shown in Figure 5) and is defined

as dep(i,j),(i ,j ). Since the only means of communica- tion between processing elements is the interconnect, the

throughput in packets per kcycles

throughput in packets per kcycles

8

14

7

12

6

10

5

8

4

6

3

4

2

2

1

015

015

12

16

12

16

pipeline depth8

pipeline depth8

12

12

4

8

4

8

4

pipeline width

4

pipeline width

(a) Flow Classification (b) IPv4-trie

Figure 7: Throughput for Different System Topologies. The number of memory interfaces per stage is M = 1 and the memory service time is S = 10.

dependent data might need to traverse several intercon- nects to reach the next node in the mapped ADAG. Thus the communication delay depends on the number of de- pendencies between all prior stages and all later stages. The amount of data that is communicated across an in- terconnect 1 k D, datak, is:

datak =

(dep(i,j),(i ,j )|i > k1 j W )

ik,1jW

(11) To simplify analysis, we assume each data element can be communicated in one clock cycle. Thus the stage

communication cost is:

τcommi

=

datai

.

(12)


clk


Equations 4, 10, and 12 can be substituted into Equa- tion 3 to obtain the overall system throughput.

6 Results

This section presents and discusses the optimization re- sults and performance tradeoff for various NPs topology parameters. Unless specified otherwise, the number of stages per interconnect is I = 1 and the number of ran- domized mapping runs is 100.

6.1System Throughput

Figure 2 has already shown the impact of topology choices on system performance. There are a large num- ber of configurations that perform poorly compared to the optimal solution for a given number of processors. To explore this issue in more detail, Figure 7 shows the system throughput for two of the four applications. The x- and y-axes vary the topology width, W , and depth, D.

Several observations can be made:

There are several configurations, where the through- put is zero. This can happen for topologies where the ADAG cannot be mapped at all.


18

M=1


16

M=2


per kcycles

M=4


14


12


in packets


10


8


throughput


6


4


2


0

2

4

6

8

10

12

14

16

pipeline width(W)

Figure 8: Throughput as a Function of System Width and Number of Memory Interfaces.

The system throughput increases with the pipeline depth D. This increase is roughly proportional to the number of processors, which indicates that this dimension provides good scalability.

For increasing pipeline width W , the throughput in- creases initially, but tails off for large W . This is due to the contention on the memory channel and severely limits scalability in this dimension.

To further explore the impact of memory contention on the system performance and scalability, we compare the throughput for different memory interface configurations in Figure 8. By increasing the number of memory in- terfaces, the overall throughput can be increased almost proportionally. In all cases, the memory interface satu- rates with about 2 processing elements per interface.

6.2System Bottlenecks

The above results indicate that memory contention can become a severe system bottleneck. To further illustrate how the total stage time is distributed between process- ing, memory access, and communication, Figures 9 and 10 show the contribution percentages. The “synchroniza- tion time,” which is shown in these figures is the amount

100%


80%


60%


480


376

183

140


40%

147

125

20%

70

70


70


26

26

26

0%


M=1

M=2

M=4

Num. of Mem. Channel

avg. proc. time avg. mem. time avg. comm. time avg. sync. time

(a) Flow Classification

100%


80%


60%


330


275


125


95


40%


96


75


20%


35

28

35


28


28

35


0%


M=1


M=2


M=4


Num . of Mem . Channel


avg. proc. time avg. mem. time avg. comm. time avg. sync. time

(b) IPv4-trie

100%


80%


4968

60%


479


40%

80


376

3443


70


20%

37


26


26

70


26

70


0%


s=1


s=10

s=100

Service Time

avg. proc. time avg. mem. time avg. sync. time avg. comm. time

(a) Flow Classification

100%


80%


60%


3504


330


275

2844


40%


35


28

26


20%


19


28

35

35


28

0%


s=1

s=10

s=100

Service Time

avg. proc. time avg. mem. time avg. sync. time avg. comm. time

(b) IPv4-trie

Figure 9: Stage Time Distribution with Varying Number of Memory Channels. The number on top of the bars indicates absolute time in clock cycles.

Figure 10: Stage Time Distribution with Varying Service Time. The number on top of the bars indicates absolute time in clock cycles.


10


S=100


of time that a processing element has to wait due to the

(R N/S)

9


S=10


S=1


global pipeline synchronization. If a processing element

8


finishes before the slowest processing element, it cannot

time

7


advance but has to stall.

service

6


Figure 9 shows the system response time distribution


over

5


for for different numbers of memory channels M . Here,


time

4


the memory service time S equals 10 clock cycles. In-


response


creasing M reduces the memory access time, but even

3


for M = 4, the memory access time dominates the over-

2


all stage time.


1


Figure 10 shows the system response time distribu-


1

2

3

4

5

6

7

8

9

10


number of processing elements per memory channel (N)


tion when varying the memory service time S. Here, the


memory channel per pipeline stage is M = 1. Only for

Figure 11: Memory Response Time as Fraction of Ser-

a very small memory service time (S = 1), the memory

vice Time over Different Number of Processors per

access delay is comparable to communication and syn-

Memory Interface.


chronization. This figure also shows that processing is


not the limiting factor for throughput.


Another way of illustrating the impact of memory de-

cess time is determined by the service time. For slower

lay is shown in Figure 11. This figure shows the response

memories and larger numbers of processing elements, the

time as a multiple of the service time over the number

response time is dominated by the queuing time, since it

of processors that share a memory channel. The differ-

increases linearly with the number of processors. This

ent lines show different memory technologies (S = 100

means that the memory access time is not only larger due

to S = 1). The observation is that for fast memories

to the increased service time (S = 10 or S = 100) but

(S = 1) and a small number of processing elements, the

also due to large queuing times (multiple service times).

response time is close to 1. This means that there is al-

All this leads to the conclusion that efficient memory

most no queuing delay in the system and the memory ac-

systems are crucial for network processor topologies that

throughput per processing element in per kcycles/PE

0.45

0.4

0.35

0.3

0.25

0.2

0.15

0.1

0.05

015

12

16

pipeline depth8

12

4

8

4

pipeline width

(a) Flow Classification

throughput per processing element in kcycles/PE


0.8


0.7


0.6


0.5


0.4


0.3


0.2


0.1


015


12

16

pipeline depth8

12

4

8

4

pipeline width

(b) IPv4-trie

Figure 12: Throughput per Processing Element Depend- ing on Topology. The number of memory interfaces per stage is M = 1 and the memory service time is S = 10.

aim at achieving high throughput by exploiting paral- lelism through multiprocessing.

6.3Design Tradeoffs

Another important question is how the overall system cost increases in order to achieve higher throughput. To illustrate this trade-off in a simple way without making any assumptions about implementation costs, we com- pare the throughput with the number of processing ele- ments used for achieving this throughput.

Figure 12 shows the system throughput divided by the number of processing elements used over the different topology choices. For small values of the pipeline width W the graph shows high values along the pipeline depth axis. This shows good scalability in the dimension of topology depth. The peaks in this figure coincide with mappings where ADAGs can be mapped without any idle processing elements. Along the pipeline width dimen- sion, scalability is very limited due to performance de- creases from memory contention.

The above results of our design space exploration can be used to extract a few general design guidelines for choosing network processor topologies:

The network processor topology has significant im- pact on the overall system performance.

Most network processing applications are of se- quential nature (rather than inherently parallel). Ex- ploiting this property leads to highly pipelined NP topologies. The task clustering and mapping pro- cess needs to aim at balancing the processing task to avoid slow pipeline stages.

Memory access is a fundamental bottleneck. Large topologies need to be matched with a large number of high-speed memories to avoid these bottlenecks.

Off-chip memory accesses cause a significant re- duction in throughput and a drastic increase in queuing delay, which emphasizes the importance of latency-hiding techniques (e.g., multithreading).

Next to the memory access delay, communication and synchronization are the main contributors to the pipeline stage time. Processing is not the limiting factor in the system throughput.

The performance model can be used to quantify these observations for any given topology and workload.

7 Conclusion

In this work, we have introduced a methodology to ex- plore the network processor design space through perfor- mance modelling. The process involves abstracting NP workloads to annotated DAGs, which can be mapped to the general NP system topology. The performance model is integrated into the randomized mapping process to ob- tain a good approximation to the NP-complete mapping problem. The performance model takes the main sys- tem components into account and considers processing, memory accesses, inter-processor communication, and the effects of pipeline synchronization. We present re- sults for a range of NP applications and topologies. The performance tradeoffs between different system topolo- gies are presented and discussed. The general design guidelines that we derive from this work present the first step towards systematically evaluating NP topologies.

There are several extensions to this work that we are considering. First, the current performance model only considers general purpose processors. Most network pro- cessors use various types of hardware accelerators and co-processors. Such processing engines could be con- sidered in our model to determine the proportions be- tween general purpose and specialized processors for a given topology. Second, the mapping algorithm cur- rently only allows one processing task to be mapped to a processing element. This leads to the side effect that some ADAGs cannot be mapped to some NP topologies (e.g., if there are fewer processors than nodes). We are currently expanding the mapping algorithm to allow for multiple nodes per processor and hope to present these results at the Anchor workshop. Third, the model does not yet consider multithreading. Multithreading has been shown to be a powerful powerful mechanism to hide the

impact of off-chip memory access latency. Many mod- ern NP architectures use multithreading and we intend to expand our model to take this into consideration.

We believe that the performance model that we pro- vide in this work is a valuable tool for fast, quantitative design space exploration of network processor system topologies. This can help in determining how future NP architectures can be designed to provide the necessary scalability to support increasing link rates and increasing application complexity.

Acknowledgements

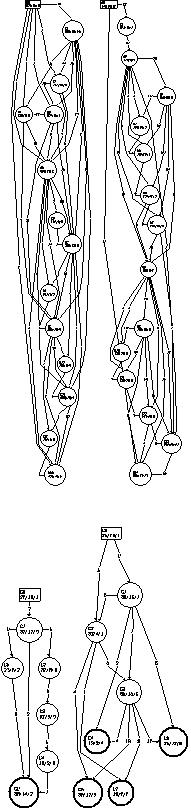
The authors would like to thank Ramaswamy Ra- maswamy for providing the run-time instruction traces that were used for the ADAG generation.

References

[1]F. Baker. Requirements for IP version 4 routers. RFC 1812, Net- work Working Group, June 1995.

[2]D. P. Bhandarkar. Analysis of memory interference in multi- processors. IEEE Trans. on Computers, c-24(9):897–908, Sept. 1975.

[3]D. Burger and T. Austin. The SimpleScalar tool set version 2.0.

Computer Architecture News, 25(3):13–25, June 1997.

[4]P. Crowley and J.-L. Baer. A modelling framework for network processor systems. In proc. of Network Processor Workshop in conjunction with Eighth International Symposium on High Per- formance Computer Architecture (HPCA-8), pages 86–96, Cam- bridge, MA, Feb. 2002.

[5]P. Crowley, M. E. Fiuczynski, J.-L. Baer, and B. N. Bershad. Characterizing processor architectures for programmable net- work interfaces. In Proc. of 2000 International Conference on Supercomputing, pages 54–65, Santa Fe, NM, May 2000.

[6]J. Daemen and V. Rijmen. The block cipher Rijndael. In Lec- ture Notes in Computer Science, volume 1820, pages 288–296. Springer-Verlag, 2000.

[7] EZchip Technologies Ltd.,

Yokneam,

Israel.

NP-

1

10-Gigabit

7-Layer

Network

Processor,

2002.

http://www.ezchip.com/html/pr np-1.html.


[8]M. A. Franklin and T. Wolf. A network processor performance and design model with benchmark parameterization. In P. Crow- ley, M. A. Franklin, H. Hadimioglu, and P. Z. Onufryk, edi- tors, Network Processor Design: Issues and Practices, Volume 1, chapter 6, pages 117–138. Morgan Kaufmann Publishers, Oct. 2002.

[9]M. A. Franklin and T. Wolf. Power considerations in network processor design. In M. A. Franklin, P. Crowley, H. Hadimioglu, and P. Z. Onufryk, editors, Network Processor Design: Issues and Practices, Volume 2, chapter 3. Morgan Kaufmann Publishers, Nov. 2003.

[10]P. A. Grasso et al. Memory interference in multimicroproces- sor systems with a time-shared bus. Proceedings of the IEEE, 131(10), Mar. 1984.

[11]M. Gries, C. Kulkarni, C. Sauer, and K. Keutzer. Exploring trade- offs in performance and programmability of processing element topologies for network processors. In Proc. of Network Processor Workshop in conjunction with Ninth International Symposium on High Performance Computer Architecture (HPCA-9), Anaheim, CA, Feb. 2003.

[12]C. H. Hoogendoorn. A general model for memory interference in multiprocessors. IEEE Trans. on Computers, c-26(10):998–1005, Oct. 1977.

[13]Intel Corp. Intel IXP1200 Network Processor, 2000. http://www.intel.com/design/network/products/npfami- ly/ixp1200.htm.

[14]Intel Corp. Intel Second Generation Network Processor, 2002. http://www.intel.com/design/network/products/npfami- ly/ixp2400.htm.

[15]R. M. Karp. An introduction to randomized algorithms. Discrete Applied Mathematics, 34(1-3):165–201, Nov. 1991.

[16]Y.-K. Kwok and I. Ahmad. FASTEST: A practical low- complexity algorithm for compile-time assignment of parallel programs to multiprocessors. IEEE Trans. Parallel Distributed Systems, 10(2):147–159, Feb. 1999.

[17]Y.-K. Kwok and I. Ahmad. Static scheduling algorithms for allo- cating directed task graphs to multiprocessors. ACM Computing Surveys, 31(4):406–471, Dec. 1999.

[18]V. Lakamraju, I. Korean, and C. M. Krishna. Filtering ran- dom networks to synthesize interconnection networks with mul- tiple objectives. IEEE Trans. Parallel Distributed Systems, 13(11):1139–1149, Nov. 2002.

[19]Lucent Technologies Inc. PayloadPlusTM Fast Pattern Processor, Apr. 2000. http://www.agere.com/support/non- nda/docs/FPPProductBrief.pdf.

[20]B. A. Malloy, E. L. Lloyd, and M. L. Souffa. Scheduling DAG’s for asynchronous multiprocessor execution. IEEE Transactions on Parallel and Distributed Systems, 5(5):498–508, May 1994.

[21]G. Memik, W. H. Mangione-Smith, and W. Hu. NetBench: A benchmarking suite for network processors. In Proc. of Interna- tional Conference on Computer-Aided Design, pages 39–42, San Jose, CA, Nov. 2001.

[22]R. Motwani and P. Raghavan. Randomized Algorithms. Cam- bridge University Press, New York, NY, 1995.

[23]National Laboratory for Applied Network Research - Passive Measurement and Analysis. Passive Measurement and Analysis, 2003. http://pma.nlanr.net/PMA/.

[24]S. Nilsson and G. Karlsson. IP-address lookup using LC-tries.

IEEE Journal on Selected Areas in Communications, 17(6):1083– 1092, June 1999.

[25]R. Ramaswamy, N. Weng, and T. Wolf. Application analysis and resource mapping for heterogeneous network processor architec- tures. In Proc. of Network Processor Workshop in conjunction with Ninth International Symposium on High Performance Com- puter Architecture (HPCA-10), pages 103–119, Madrid, Spain, Feb. 2004.

[26]R. Ramaswamy and T. Wolf. PacketBench: A tool for workload characterization of network processing. In Proc. of IEEE 6th An- nual Workshop on Workload Characterization (WWC-6), pages 42–50, Austin, TX, Oct. 2003.

[27]G. L. Reijns and A. J. C. van Gemund. Analysis of a shared- memory multiprocessor via a novel queuing model. Journal of Systems Architecture, 45(14):1189–1193, 1999.

[28]TCPDUMP Repository. http://www.tcpdump.org, 2003.

[29]L. Thiele, S. Chakraborty, M. Gries, and S. Kunzli¨. Design space exploration of network processor architectures. In Proc. of Net- work Processor Workshop in conjunction with Eighth Interna- tional Symposium on High Performance Computer Architecture (HPCA-8), pages 30–41, Cambridge, MA, Feb. 2002.

[30]A. J. C. van Gemund. Performances prediction of parallel pro- cessing systems: The pamela methodology. In Proc. 7th ACM International Conference on Supercomputing, pages 318–327, Tokyo, Japan, July 1993.

[31]Y.-C. Wei and C.-K. Cheng. Ratio cut partitioning for hierarchi- cal designs. IEEE Transactions on Computer-Aided Design of Integrated Circuits and Systems, 10(7):911–921, July 1991.

[32]T. Wolf and M. A. Franklin. CommBench - a telecommunica- tions benchmark for network processors. In Proc. of IEEE In- ternational Symposium on Performance Analysis of Systems and Software (ISPASS), pages 154–162, Austin, TX, Apr. 2000.
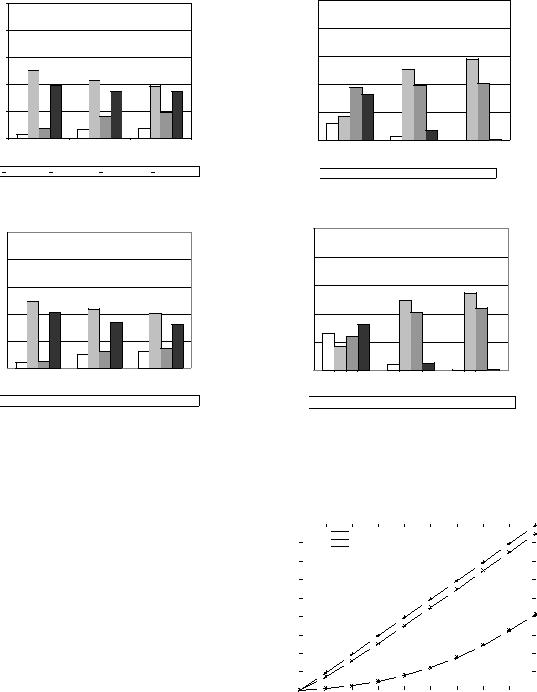