
Abstract
Table of contents
1. Background
2. Goals and objectives that must be resolved
3. A review of research and development
3.1 Overview of international sources
3.2 Overview of national and local sources
Introduction
The term forecast
(from the Greek Prognosis
– foresight, prediction) originally appeared in medicine
to predict the course and outcome of the disease, and then was moved in all spheres of human life and activity.
Prediction – specialized activity, the development of the forecast. In a narrow sense – specific targeted research development prospects of a phenomenon (eg, labor market, unemployment, migration, etc.). As a form of concretization of scientific prediction in the social sphere, is closely linked with the planning, programming, design, goal setting, organizational management. Distinguish the search ( genetic, survey, research ) and regulatory design. The first has to obtain a prediction of the state of the object of investigation in the future observed trends, assuming that the latter are not to be changed by making the subject of management (plans, programs, projects, etc.). The second prediction is referring to how to achieve the desired state of the object on the basis of predetermined criteria, objectives and standards.
Forecasting is applied in development plans (called preplanning forecast) and promotes the development of the basic
concepts of the planning period, as well as playing an important role in the implementation phase of the plan, assess the current state of affairs
and to find opportunities and avenues of additional management actions designed to eliminate deviations from scheduled plan development trajectory.
Role in the management of forecasting is difficult to overestimate. No wonder experienced executives say, Who does not foresee any problems,
he can not run
[1].
1. Background
Currently being reformed state OSH management system in the national system of complex safety of industrial activity
to a new level – risk management. First of all – this is a departure from the old methodological framework (The concept of absolute security
)
and the transition to the new – The concept of acceptable risk
. Avoiding the main postulate of the old concept – the assertion of the possibility
of eliminating all accidents, fires, injuries and diseases, and the transition to the last – the indispensability of the risks associated with
human activity.
At the moment it is on the prediction of occupational injuries are concentrated the main decisions in this area. And such forecasts are not so much for health care facilities, but for manufacturing enterprises to improve the quality of health and safety. At the same time trauma hospitals in need of computerized systems of statistical processing of quantitative data on various types of injuries, with the ability to predict the amount of injury for a specified period of time. This forecast will provide a timely opportunity to prepare the necessary amount of medicines, hospital beds, medical staff to provide high quality patient care.
2. Goals and objectives that must be resolved
Based on the analysis of existing solutions in the study area was concluded on the need for a specialized computer system that will perform the following functions:
- based on the input data to make a prediction about the possible number of injuries for a predetermined period of time;
- the likelihood of a certain type of injury depending on the season;
- choice for the forecast period;
- providing forecasting results in numerical and graphical display.
The initial data in this study will be used monthly data on the number of appeals to the Regional Trauma Hospital in the city of Donetsk in the period from 2004 to 2012. These data are: total number of injures, injured limbs, eye injury, neurosurgical trauma.
3. A review of research and development
3.1 Overview of international sources
Analysis of the publications of scientific developments overseas colleagues on a similar theme showed that major developments are related to the prediction of occupational injuries. Abroad, however, such developments are of great interest not only for managers but also for insurance companies.
One of these works can be called an article that was published in the Proceedings of the International Conference on the basic and applied sciences [2]. The main objective of this study is to forecast the amount of work-related injuries from 2011 to 2015 using appropriate models. These models have been tested on actual data from 1972 to 2010. For comparison, we selected three different forecasting models.
Prediction of injuries of passengers rail vehicles [3]. This work was written in order to predict the possible injury to the driver and passengers, as well as to determine injury rates among rail passengers. The work was performed using the experimentally obtained data by numerical simulation. Were taken into account factors that affect passengers that may involve an injury. Also, the authors conducted an analysis of the most vulnerable places for passengers and driver.
Forecasting the number of fatalities in underground coal mines [4]. This paper considers the prediction of the number of fatalities in underground coal mines using a hybrid model of ARIMA methods and artificial neural network.
3.2 Overview of national and local sources
In Ukraine and Russia forecasting injuries, mainly divided into forecasting occupational accidents and injuries forecasting outcomes and possible complications.
As an example, the first article in the Journal of Neurology and Psychiatry im. S. S. Korsakova
Predicting outcomes of injuries and brain injuries secondary to severe in victims evacuated from the battle area
[7].
The purpose of research - evaluation of predictors and models to predict the next outcome in traumatic brain injury secondary to severe.
Retrospectively analyzed 75 patients with histories of injuries or brain injuries secondary to severe. To build predictive models used multiple
linear regression methods and classification tree. These results confirm the prognostic value of the Glasgow coma scale. Additional accounting
indicators characterizing the severity of inflammation and organ failure, can significantly improve the prediction model outcomes in traumatic
brain injury.
As for the works of graduates DONNTU, the works also, for the most part, focused on predicting outcomes of injuries.
For example, the master's work Cherkassovoy Zhanny Vladimirovny [8] on Predicting the dynamics of cerebral
injury in Donetsk
. The work consisted in predicting the dynamics of traumatic brain injury (TBI) with the following data: for the original
sample, containing data on the number of head injury, matching the criteria (for example – a certain age, gender, type of injury) for the period
of pre-emption of the forecast (in this case 1996–1999) necessary to predict the number of TBI in a given period of 1 to 10 years.
The existing database contains a large set of features that was possible to analyze the data, such as date of injury, day of the week in which
the injury occurred. gender, age, social status of the victim; type of injury; outcome of injury, etc.
4. Forecasting injuries
Currently there are many methods and techniques of forecasting. All prediction methods can be divided into two main classes: heuristic and math.
Heuristic methods based on the use of expert opinions in the field of knowledge and, as a rule, are used to predict the processes of embarrassing for mathematical description. To get good enough to practice the prediction results based on the use of expert opinion, it is necessary to solve a number of problems associated with the organization of the poll, the selection of experts and the processing of the results. Use this method if there are no numerical indicators parameter projected for the period.
One of the most famous methods of expert assessments is Delphi method, which is based on the following rules: a survey of experts in several stages; answers are given to quantify; after statistical processing of the results, each expert met with estimates of other experts; answers must be accompanied by justifications.
Mathematical methods of forecasting, depending on the mathematical description of objects and forecasting methods to determine the unknown parameters of the model can be divided into methods for modeling the processes of development, extrapolation (statistical) methods and probabilistic methods.
The first group includes the methods used to describe the process model predicted differential equations. Forecasting problem reduces to the solution of differential equations for a given point in time. Prediction based on the modeling of development processes can be successfully used if the forecast process has been well studied and it has the correct mathematical description.
Extrapolation (statistical ) method is one of the most common methods of forecasting when the trend of the development process, which is observed in the past, extended in the future.
Among all the statistical regression analysis plays a predominant role in the prediction. Using regression equations to predict the values of the various indicators should be based on the retention of future quantitative patterns found by the processing of past observations. In predictive regression equation, unlike conventional regression in the number of factor arguments should include explicit time.
Assessing the quality of the forecast obtained by the regression equations should be aware of the objective features of the application of regression equations. Here, you first need to know that the problem involves the use of forecasting regression equation to estimate the values of the projected figure outside the range of actual observations on which the equation of regression, ie, have to go beyond observation and solve the problem of extrapolation. It is understood that the proximity of the initial forecast of observations depends on the accuracy of the values of factor arguments.
Next problem is the fact that the evaluation of the values projected figure is necessary to know the predicted values of factor arguments, ie, the prediction accuracy depends not only on the accuracy of the regression coefficients, but also the reliability of the factors determining the values of the arguments, in the future tense. Marked features of the application of regression equations to predict (extrapolation, reliability factors, assumed values of the arguments) are the cause of increased uncertainty of the results. Because of this, it is advisable to be determined using a regression not specific values projected figure and the confidence interval, within which are the values of this index.
Probabilistic method is used in cases of mass measurements of the test parameter. Fairly complete description of the body form of mass measurements is to determine the laws of distribution of the quantities [9].
Temporal sequence – an ordered sequence of observations in time (implementations) variable. Time series analysis is used to predict the variable only historical data is changed. Thus, if the research data on monthly sales of mobile phones shows that they increase linearly – to represent this process can be chosen linear model trend. The slope and offset of this line can be estimated based on historical data. Forecasting can be done by extrapolating the appropriate model.
Causal link between the use of models of interest to us and the time sequence of one or more other time sequences. If these other variables are correlated with the variable of interest, and if there are reasons for this correlation, predictive models that describe these relationships can be very useful. In this case, knowing the value of correlated variables, we can construct a model for prediction of the dependent variable. Serious limitation of the use of causal models is the requirement that the independent variable was known by the time the forecast is made. Another limitation of causal methods – large amount of computation and data that you want to compare.
The choice of the appropriate method of forecasting, the following factors:
- the desired shape of the forecast;
- horizon period and interval forecasting;
- availability of data;
- the required accuracy;
- behavior predicted process;
- the cost of development, installation and operation of the system[11].
- ARIMA method;
- artificial neural networks;
- situational modeling methods that are implemented in systems Simulink and Stateflow;
- combined methods.
Artificial neural networks – are network elements – the artificial neurons - linked synaptic connections. The network processes the input information and the process of changing its state generates a set of time in the output signals. After the network is to transform the input signal in time, thereby changing the internal state of the network and generates an output effect.

Figure 1 – The artificial neuron (animation). Rotation's cout: 10.
The advantages of artificial neural networks are:
- adaptive structure that receives the information, trained and captures useful contacts in the complex interaction of input and output information;
- the ability to work with highly noisy data;
- simultaneous and rapid execution of many identical and independent operations.
The basis of each of the neural network is a relatively simple, in most cases – the same type of elements (neurons) that mimic the work of brain neurons. Each neuron is characterized by its current state, by analogy with the nerve cells of the brain, which can be excited or inhibited. It has a group of synapses – unidirectional input links connected to the outputs of other neurons, and also has an axon – output relationship of the neuron from which the signal (excitation or inhibition) arrives at the following synapses of neurons.
By the time of the completion of the author's abstract was made by ARIMA forecasting data for the year 2012 in order to verify the correctness of the chosen method. ARIMA-processes of the Box-Jenkins is a family of linear statistical models, based on a normal distribution, which allows to simulate the behavior of a variety of different time series by combining autoregressive processes, processes of integration processes and moving average.
General view of the procedures for using the Box-Jenkins method is as follows :
- The family ARIMA-processes the Box-Jenkins chosen a fairly simple process that allows to obtain data, which generally look about the same as our series (except for the random factor). To do this you need to select a specific type of model and estimate the required parameters on the basis of their data. From the resulting model can be found in the extent to which each observation affects the future and to what extent each observation provides useful new information to predict the future.
- Forecast at any given time represents the expected (i.e.,average) value of the estimated future process at this time. The formula for forecasting allows you to quickly calculate the mean value for the countless number of behaviors, ranging from raw data and extrapolating them in accordance with the selected model.
- Standard error of prediction for any time is the standard deviation of all possible (permissible) future values for this time[10].
- The forecast boundaries extend above and below the predicted value, so that (if the chosen model was correct) with a probability of,
for example, 95% of it can be argued. that the future value for any time keep within the specified bounds of the forecast. These boundaries are
formed forecast so that for each future period of time 95% of possible ( and acceptable) behavior of a number of options for the future fit into
these boundaries.
Based on available data the values ??were obtained linear trend and seasonal component. Were then calculated trend values, adjusted for seasonality. Graphic representation of the results obtained is shown in Fig.2.
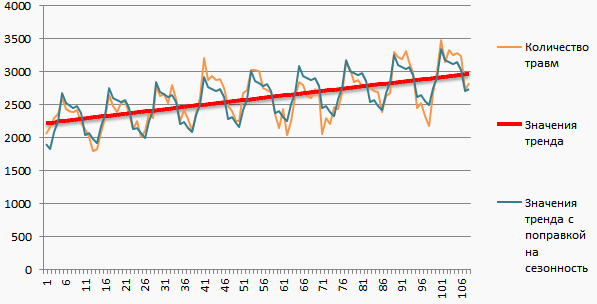
Figure 2 – Visualization of the results
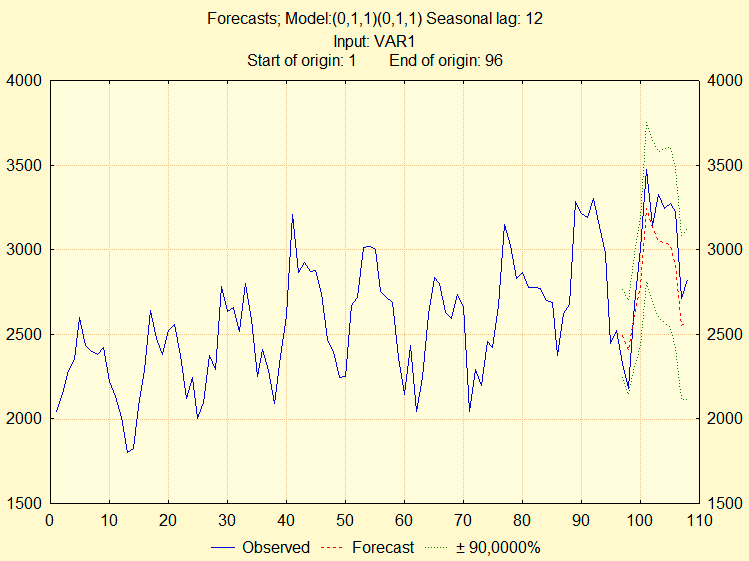
Figure 3 – Visualization of practical and expected values for 2012
Conclusions
The analysis of available data. On this basis, the values of the linear trend and seasonal component. The values of the trend, adjusted for seasonality. Obtained the expected results. Analysis of the data and allow visual assessment to judge the correctness of the results.
In writing this abstract master's work is not yet complete. Final completion: December 2014. Full text of the work and materials on the topic can be obtained from the author or his manager after that date.
List of sources:
- Ńóůíîńňü ďđîăíîçčđîâŕíč˙. Internet resource.
- Time series forecasting of future claims amount of SOCSO's employment injury scheme (EIS). Internet resource.
- Forecasting impact injuries of unrestrained occupants in railway vehicle passenger compartments. Internet resource.
- Forecasting the number of fatal injuries in underground coal mines. Internet resource.
- Forecasting the Future. Internet resource.
- NFL Week 9 Injury Report: Forecasting Impact on Fantasy Football. Internet resource.
- Ďđîăíîçčđîâŕíčĺ čńőîäîâ ňđŕâě č đŕíĺíčé ăîëîâíîăî ěîçăŕ ńđĺäíĺé č ň˙ćĺëîé ńňĺďĺíč ň˙ćĺńňč ó ďîńňđŕäŕâřčő, ýâŕęóčđîâŕííűő čç đŕéîíîâ áîĺâűő äĺéńňâčé. Internet resource.
- Ńňđŕíčöŕ ěŕăčńňđŕ ÄîíÍŇÓ Ć. Â. ×ĺđęŕńńîâîé.Internet resource.
- Ŕ. Ŕ. Ĺćîâ
Íĺéđîęîěďüţňčíă č ĺăî ďđčěĺíĺíč˙ â ýęîíîěčęĺ č áčçíĺńĺ
(ńĺđč˙Ó÷ĺáíčęč ýęîíîěčęî-ŕíŕëčňč÷ĺńęîăî číńňčňóňŕ ĚČÔČ
ďîä đĺä. ďđîô. Â.Â. Őŕđčňîíîâŕ)/Ŕ. Ŕ. Ĺćîâ, Ń. Ŕ. Řóěńęčé. –Ě.: ĚČÔČ, 1998. – 224 ń. - Ý. Ńčăĺë
Ďđŕęňč÷ĺńęŕ˙ áčçíĺń‑ńňŕňčńňčęŕ
.: Ďĺđ. ń ŕíăë. – Ě.: Čçäŕňĺëüńęčé äîěÂčëü˙ěń
, 2002. – 1056 ń. - Ă. Ń. Ęčëüäűřĺâ
Ŕíŕëčç âđĺěĺííűő đ˙äîâ č ďđîăíîçčđîâŕíčĺ
/Ă. Ń. Ęčëüäűřĺâ,Ŕ. Ŕ. Ôđĺíęĺëü – Ě.: Ńňŕňčńňčęŕ. 1973.